
Example 1. Timeline Examples
All timeline examples and samples included in Timeline Diagrams Solution are professionally designed and available for ConceptDraw DIAGRAM users from ConceptDraw STORE.

Example 2. Timeline Diagrams Solution in ConceptDraw STORE
Use of ready timeline examples will help you in drawing timeline diagrams. Each sample or template from the offered in ConceptDraw STORE can be used as is or as the base for your own timeline diagram.

Example 3. Timeline Examples - NPA Major Events
The timeline examples you see on this page were created in ConceptDraw DIAGRAM software using the tools of Timeline Diagrams Solution. An experienced user spent 10 minutes creating each of these examples.
Use the Timeline Diagrams Solution to create your own timeline diagrams of any complexity fast and easy.
All source documents are vector graphic documents. They are available for reviewing, modifying, or converting to a variety of formats (PDF file, MS PowerPoint, MS Visio, and many other graphic formats) from the ConceptDraw STORE. The Timeline Diagrams Solution is available for all ConceptDraw DIAGRAM or later users.
TEN RELATED HOW TO's:
The Flowchart is a very popular type of diagram, it is widely used for analyzing, designing, managing and visualizing the business and technical processes, various software algorithms. But how to create Flowchart quick and easy?
Flowcharts solution from the Diagrams area of ConceptDraw Solution Park helps you to design the professional looking Flowchart Diagrams quick and easy using the ConceptDraw DIAGRAM diagramming and vector drawing software.
Picture: Create Flowchart - Making a Flowchart
Related Solution:
ConceptDraw Metro Maps solution is a one-click tool to add stations to the metro map. It lets you control the direction in which you create new stations, change lengths, and add text labels and icons. It contains Lines, Stations, and Landmarks objects.
The Metro Map Solution from the Maps Area uses two ConceptDraw techniques: Replicating Objects and Switching Objects. And the result is a vector graphic document.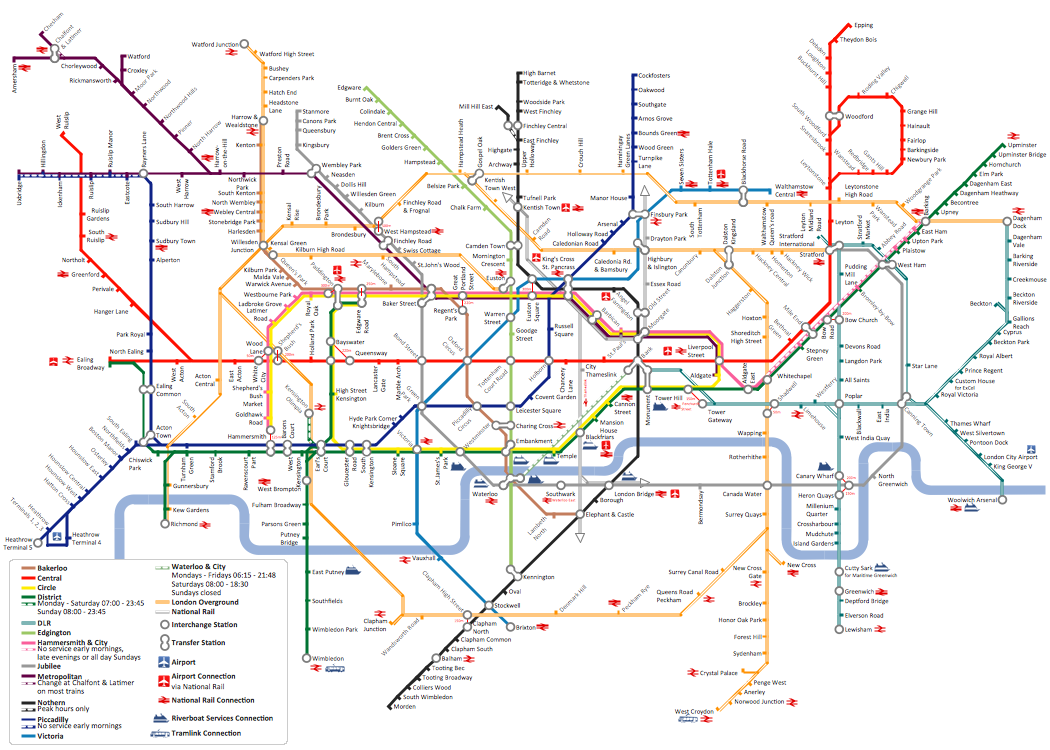
Picture: Metro Map
Related Solution:
Column chart examples from ConceptDraw collection can help you find the best visual depiction for you data. You can easily modify column chart examples according to data you want to visualize.
Picture: Column Chart Examples
Related Solution:
ConceptDraw DIAGRAM enhanced with Flowcharts Solution is the best flow chart maker online design software. Use it to ✔️ create clear and actionable Flowcharts, ✔️ improve decision-making, ✔️ enhance problem-solving in various scenarios, ✔️ enhance creativity and productivity across industries, ✔️ streamline workflows
Picture: Flow Chart Online
Related Solution:
The Value Stream Map (VSM) is one of the most common lean management tools. ConceptDraw DIAGRAM diagramming and vector drawing software supplied with Value Stream Mapping solution is ideal for drawing Value Stream Maps. Value Stream Mapping solution from the Quality area of ConceptDraw Solution Park includes a variety of value stream mapping examples.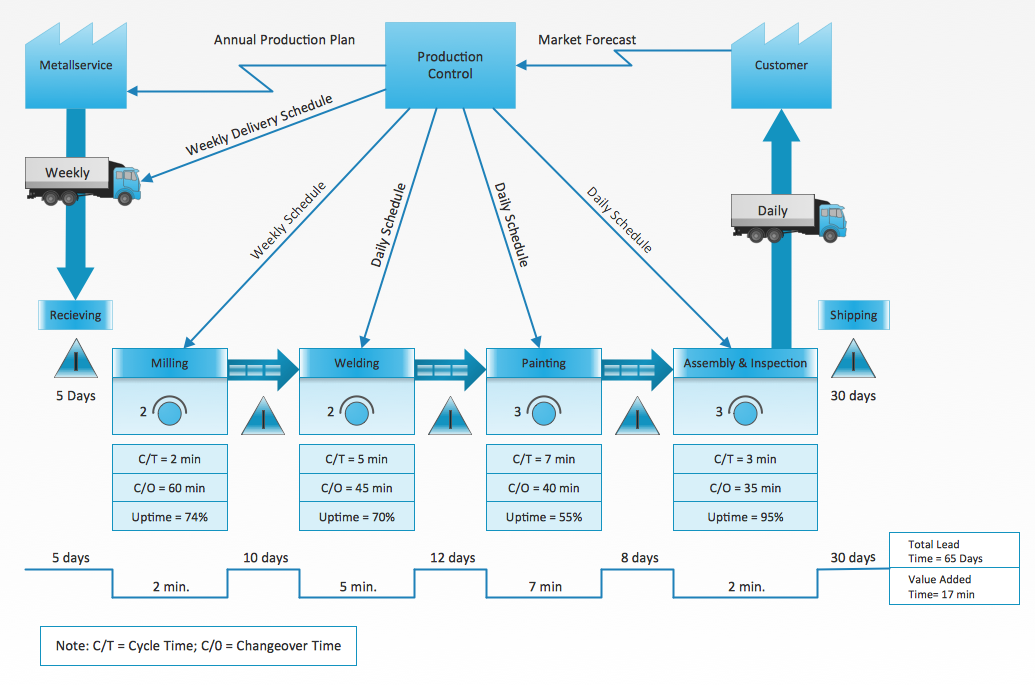
Picture: Value Stream Mapping Examples
Related Solution:
ConceptDraw PROJECT is a vigorous tool for managing single or multiple projects. It lets you determine all essential elements involved into project, control schedules, resources and finances, and monitor projects' progress in most effective yet simple manner.
Picture: Product Overview
The PERT Chart is constructed as part of the process in creating a schedule of corrective actions. The PERT Chart shows the logical connections and consequence of tasks to be performed. It displays the time period for problem solving and the implementation of all activities through the critical path.
ConceptDraw Office suite is a software for corrective actions planning.
Picture: CORRECTIVE ACTIONS PLANNING. PERT Chart
All Gantt charts were made using ConceptDraw PROJECT. ConceptDraw PROJECT works both on Windows and Mac OS X. It allows to schedule a voluntary number of projects in a single Workspace document and lets easily share tasks and resources among them. ConceptDraw PROJECT shares files among Windows and Mac OS X.
Picture: Gantt chart examples
UML Diagrams Social Networking Sites Project. This sample was created in ConceptDraw DIAGRAM diagramming and vector drawing software using the UML Use Case Diagram library of the Rapid UML Solution from the Software Development area of ConceptDraw Solution Park.
This sample shows the Facebook Socio-health system and is used at the projection and creating of the social networking sites.
Picture: UML Use Case Diagram Example. Social Networking Sites Project
Related Solution:
The vector stencils library SSADM from the solution Systems engineering contains specific symbols of SSADM diagrams for ConceptDraw DIAGRAM software.
Picture: SSADM Diagram

