Design Elements for UML Diagrams
“Unified Modelling Language” is known to be useful for applying in different spheres of business activity (e.g., internet technologies, finance, banking, aerospace healthcare, etc.), being an accepted standard for modelling any needed systems. There are a few notations you can use for making your “UML diagrams”, being made for visual representation of any needed requirements, subsystems, both logical and physical elements as well as structural and behavioural patterns. Being standardized as well as “general-purpose” language, Unified Modelling one is very popular, especially in software engineering, including a set of the graphic notation techniques to use them for creating different visual models of software-intensive as well as object-oriented systems. There are thirteen types of Unified Modelling Language diagrams, all of which you can create within ConceptDraw DIAGRAM software. Having it means being able to finish with a final result within only a few hours or minutes, getting a great as well as smart looking diagrams in the end. The mentioned types of UML diagrams, that can be always created with a use of ConceptDraw DIAGRAM as well as the solution from ConceptDraw STORE, are: “class” (also known as “package”), “sequence”, “collaboration”, “use case”, “object”, “component”, “activity”, “state machine”, “deployment”, “composite structure”, “timing” and “interaction overview” UML diagrams. Some of the described types of Unified Modelling Language will be described later in this article.
Thus, in software engineering a class diagram is quite often used within the Unified Modelling Language), being one of the types of static structure diagrams that describe the structure of a system in a way of showing the system's classes, their attributes, the relationships among objects as well as the operations. Such class diagrams are the main building blocks of object-oriented modelling, being used both for detailed modelling translating the models into the programming code and for general so called “conceptual modelling” of the systematics of any needed application to apply them to. These class diagrams can also be used for data modelling, having the “classes” representing both the main elements, the classes to be programmed as well as the interactions within the appropriate application.
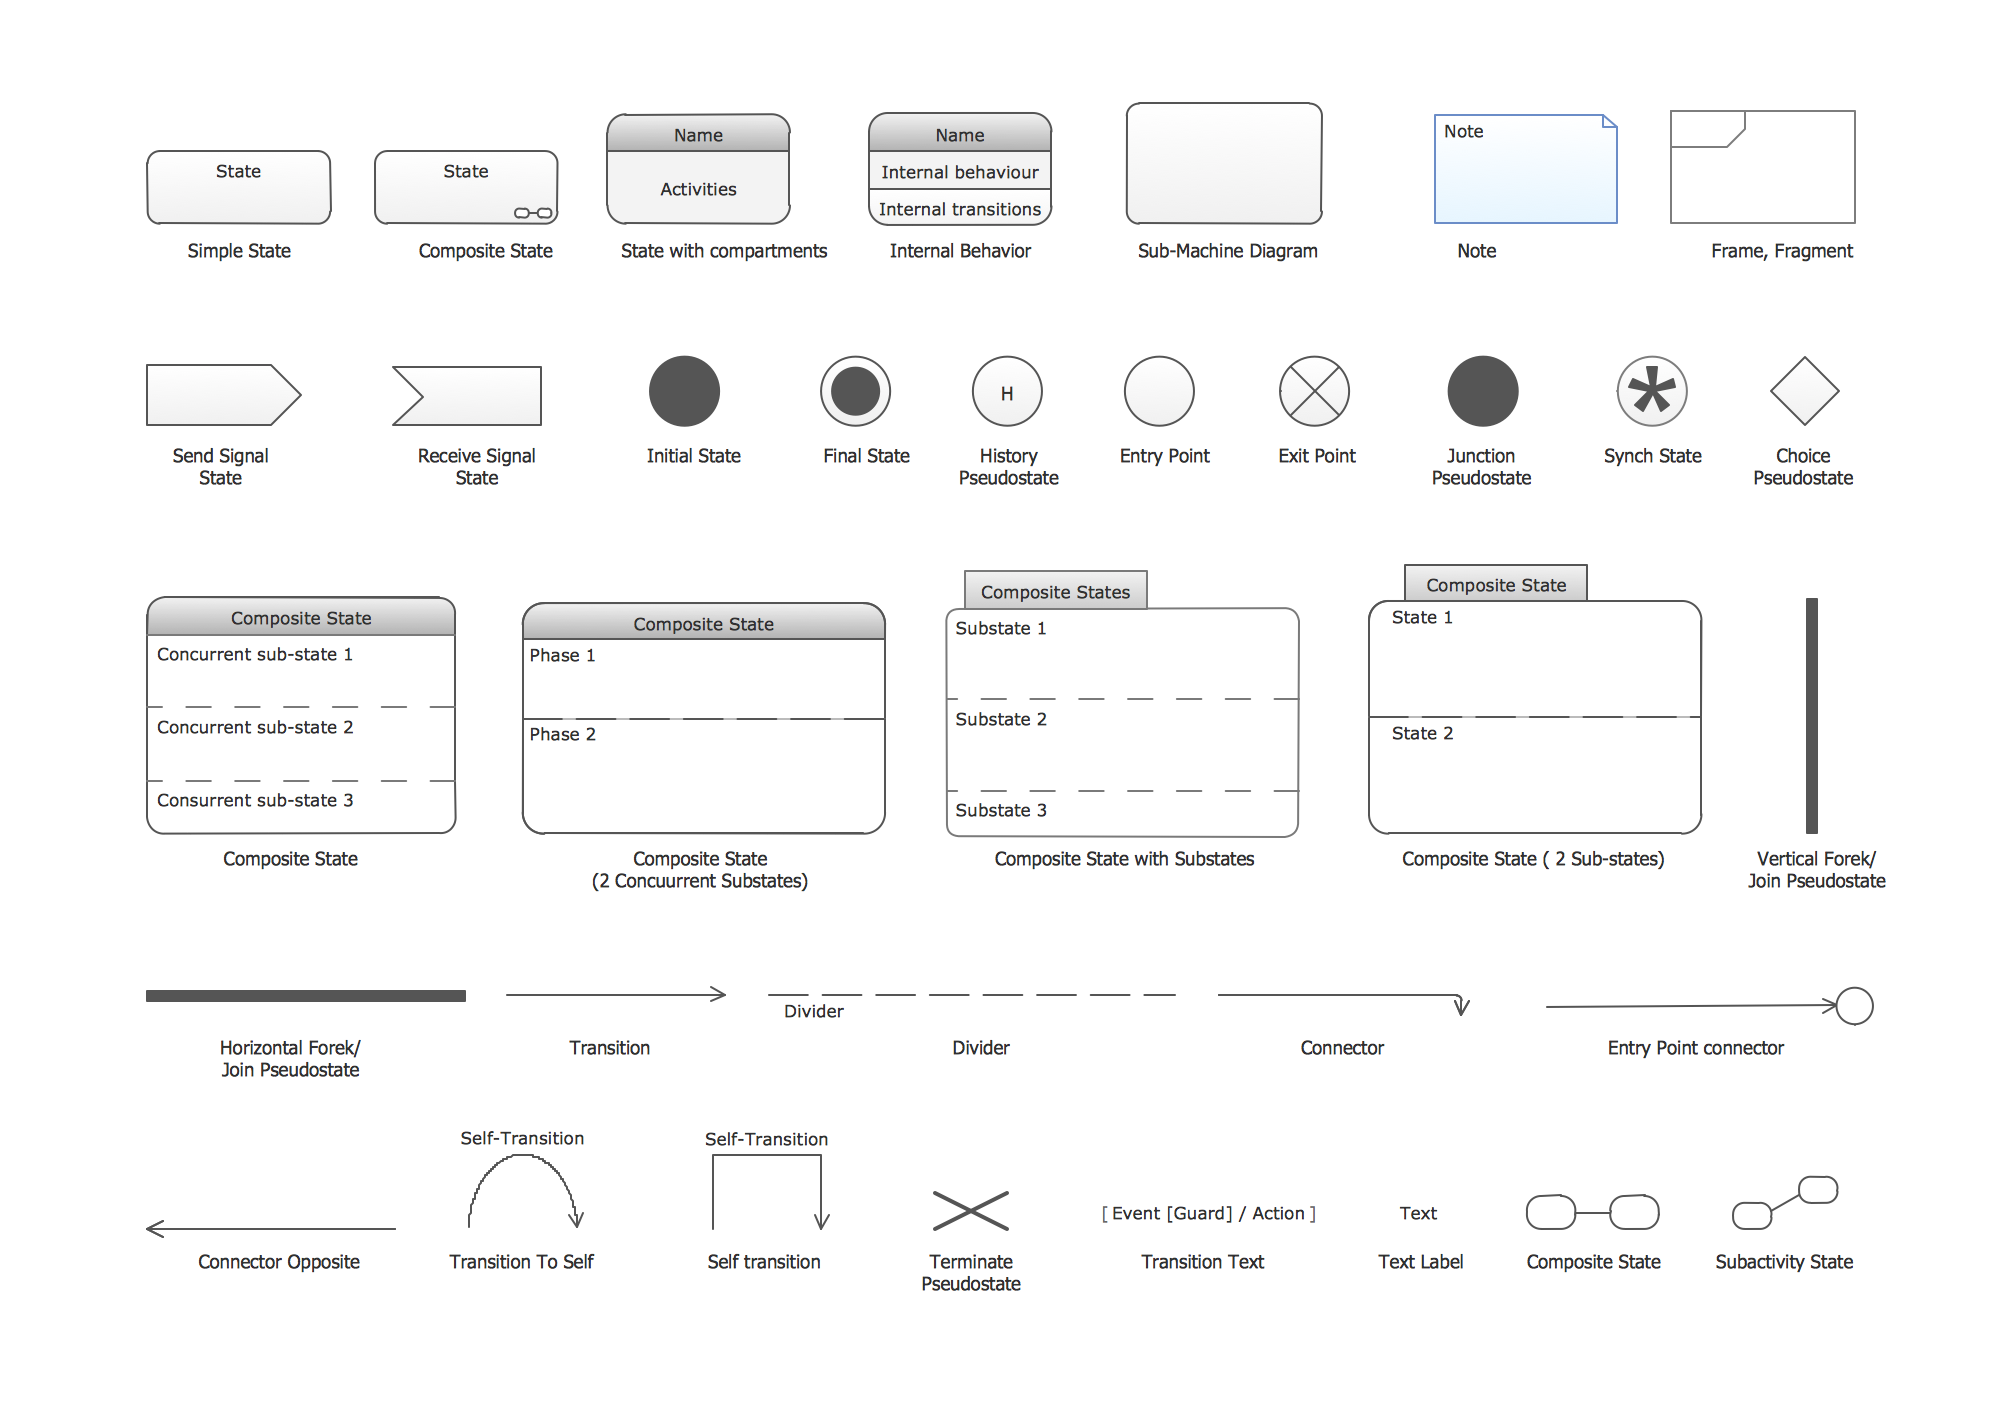
In this type of diagram, classes are usually represented in a way of boxes containing three compartments: the name of the class, the attributes of the class and the operations the class can execute. Some classes can be identified as well as grouped together in a class diagram helping to determine the static relations between them. Being busy with detailed modelling, you can always split the classes of the conceptual design into a number of subclasses while creating any needed class diagram using ConceptDraw DIAGRAM software. UML state machine diagram can be also created with help of ConceptDraw DIAGRAM diagramming application, being also known as so called “UML state-chart”. It is simply an enhanced realization of the mathematical concept of a “finite automaton”, being a mathematical model of computation – an abstract machine, being one of a finite number of states at any given time, widely used in computer science applications within the UML notation. The main reason for using such kind of diagrams is to organize the way some computer program, device or other technical process works.
The goal for using the UML state machines is to overcome the main limitations of so called traditional “finite-state machines” while retaining their main benefits, as UML state-charts introduce the new concepts of orthogonal regions and hierarchically nested states, while extending the notion of actions, having the characteristics of both Moore machines and Mealy ones, supporting actions, which depend on both the triggering event and state of the system.
The term "UML state machine" can also be referred to two kinds of state machines, which are protocol state machines and behavioural state machines. The last mentioned can be used to model the behaviour of some individual entities, such as class instances, for example. At the same time protocol state machines are usually used for expressing usage protocols, being used for specifying the legal usage scenarios of classifiers, ports and interfaces.
It’s case it’s needed, you can always create any of the previously mentioned as well as described above “Unified Modelling Language diagrams” with help of ConceptDraw DIAGRAM software, using the application ConceptDraw STORE as it is the one where you can find the needed solutions, full of the pre-made examples of such UML diagrams and stencil libraries, where you can get the design symbols from. Downloading the ConceptDraw DIAGRAM application mean taking a first step towards getting a very smart and professional result, whether you need a diagram to be created or some other drawing, such as charts, flowcharts, map or scheme. It is also always beneficial to have ConceptDraw STORE application, as it was mentioned before, as this new product of “CS Odessa” allows all ConceptDraw DIAGRAM users to download any needed solution they need for making their flowcharts, maps, charts, schemes, plans, and diagrams, including the UML ones.
If you think of making a “class”, “sequence”, “use case”, “collaboration”, “object”, “component”, “state machine”, “activity”, “deployment”, “timing”, “interaction overview” or “composite structure” UML diagram, then you can always open ConceptDraw DIAGRAM application and using the “Rapid UML” solution from ConceptDraw STORE, which will enable you to make any of the Unified Modelling Language diagrams, described before. Having this solution means having an opportunity to use the pre-made samples and templates from it and so to simplify your work of creating great looking as well as simply professionally looking diagrams in ConceptDraw DIAGRAM software.
UML Diagrams — Design Elements
UML 2.4 diagrams represent two different views of a system model:
- Static (or structural) view: emphasizes the static structure of the system using objects, attributes, operations and relationships. The structural view includes class diagrams, component diagrams, composite structure diagrams, deployment diagrams, object diagrams, package diagrams, profile diagrams.
- Dynamic (or behavioral) view: emphasizes the dynamic behavior of the system by showing collaborations among objects and changes to the internal states of objects. This view includes activity diagrams, communication diagrams, interaction overview diagram, sequence diagrams, state machine diagrams, timing diagrams, use case diagrams.
[Unified Modeling Language. Wikipedia]
The Rapid UML solution from Software Development area of ConceptDraw Solution Park includes 13 vector stencils libraries for drawing the UML 2.4 diagrams using ConceptDraw DIAGRAM diagramming and vector drawing software.
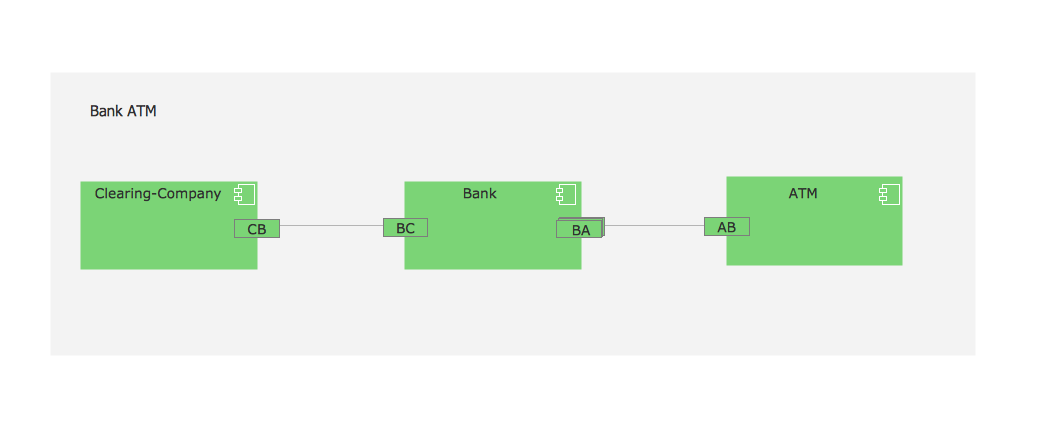
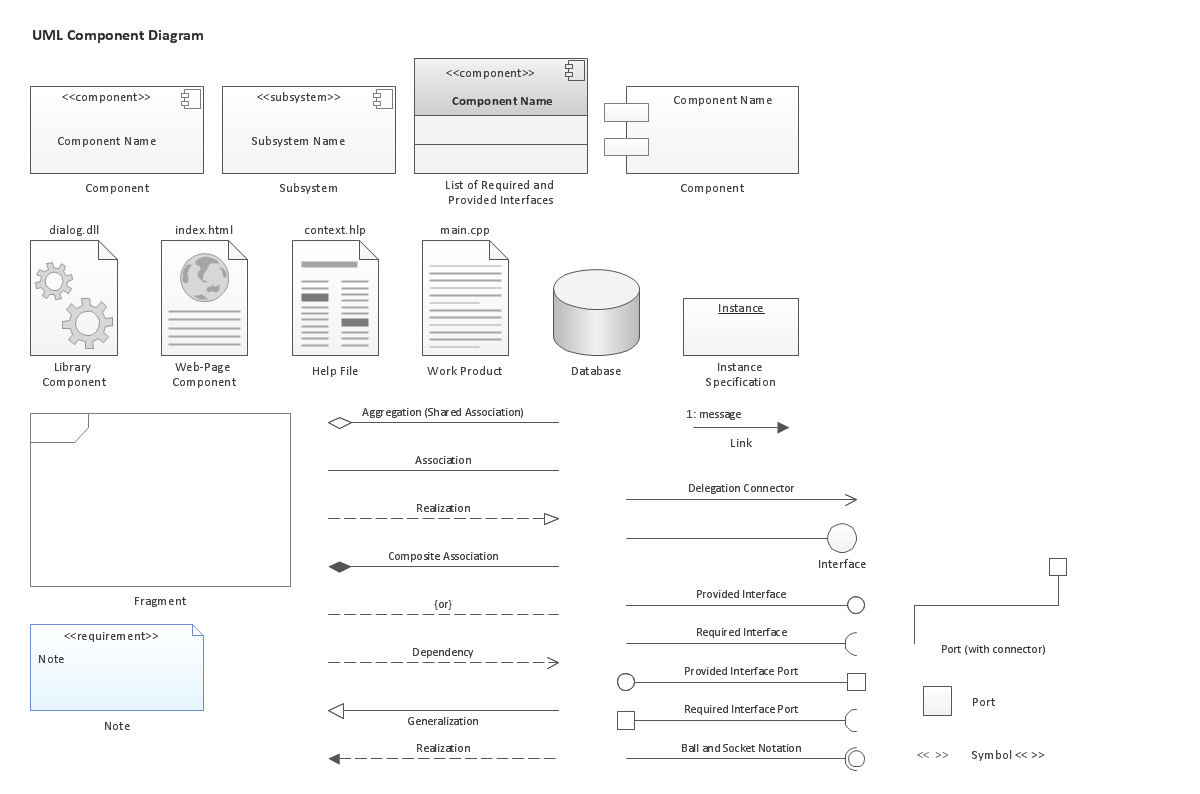
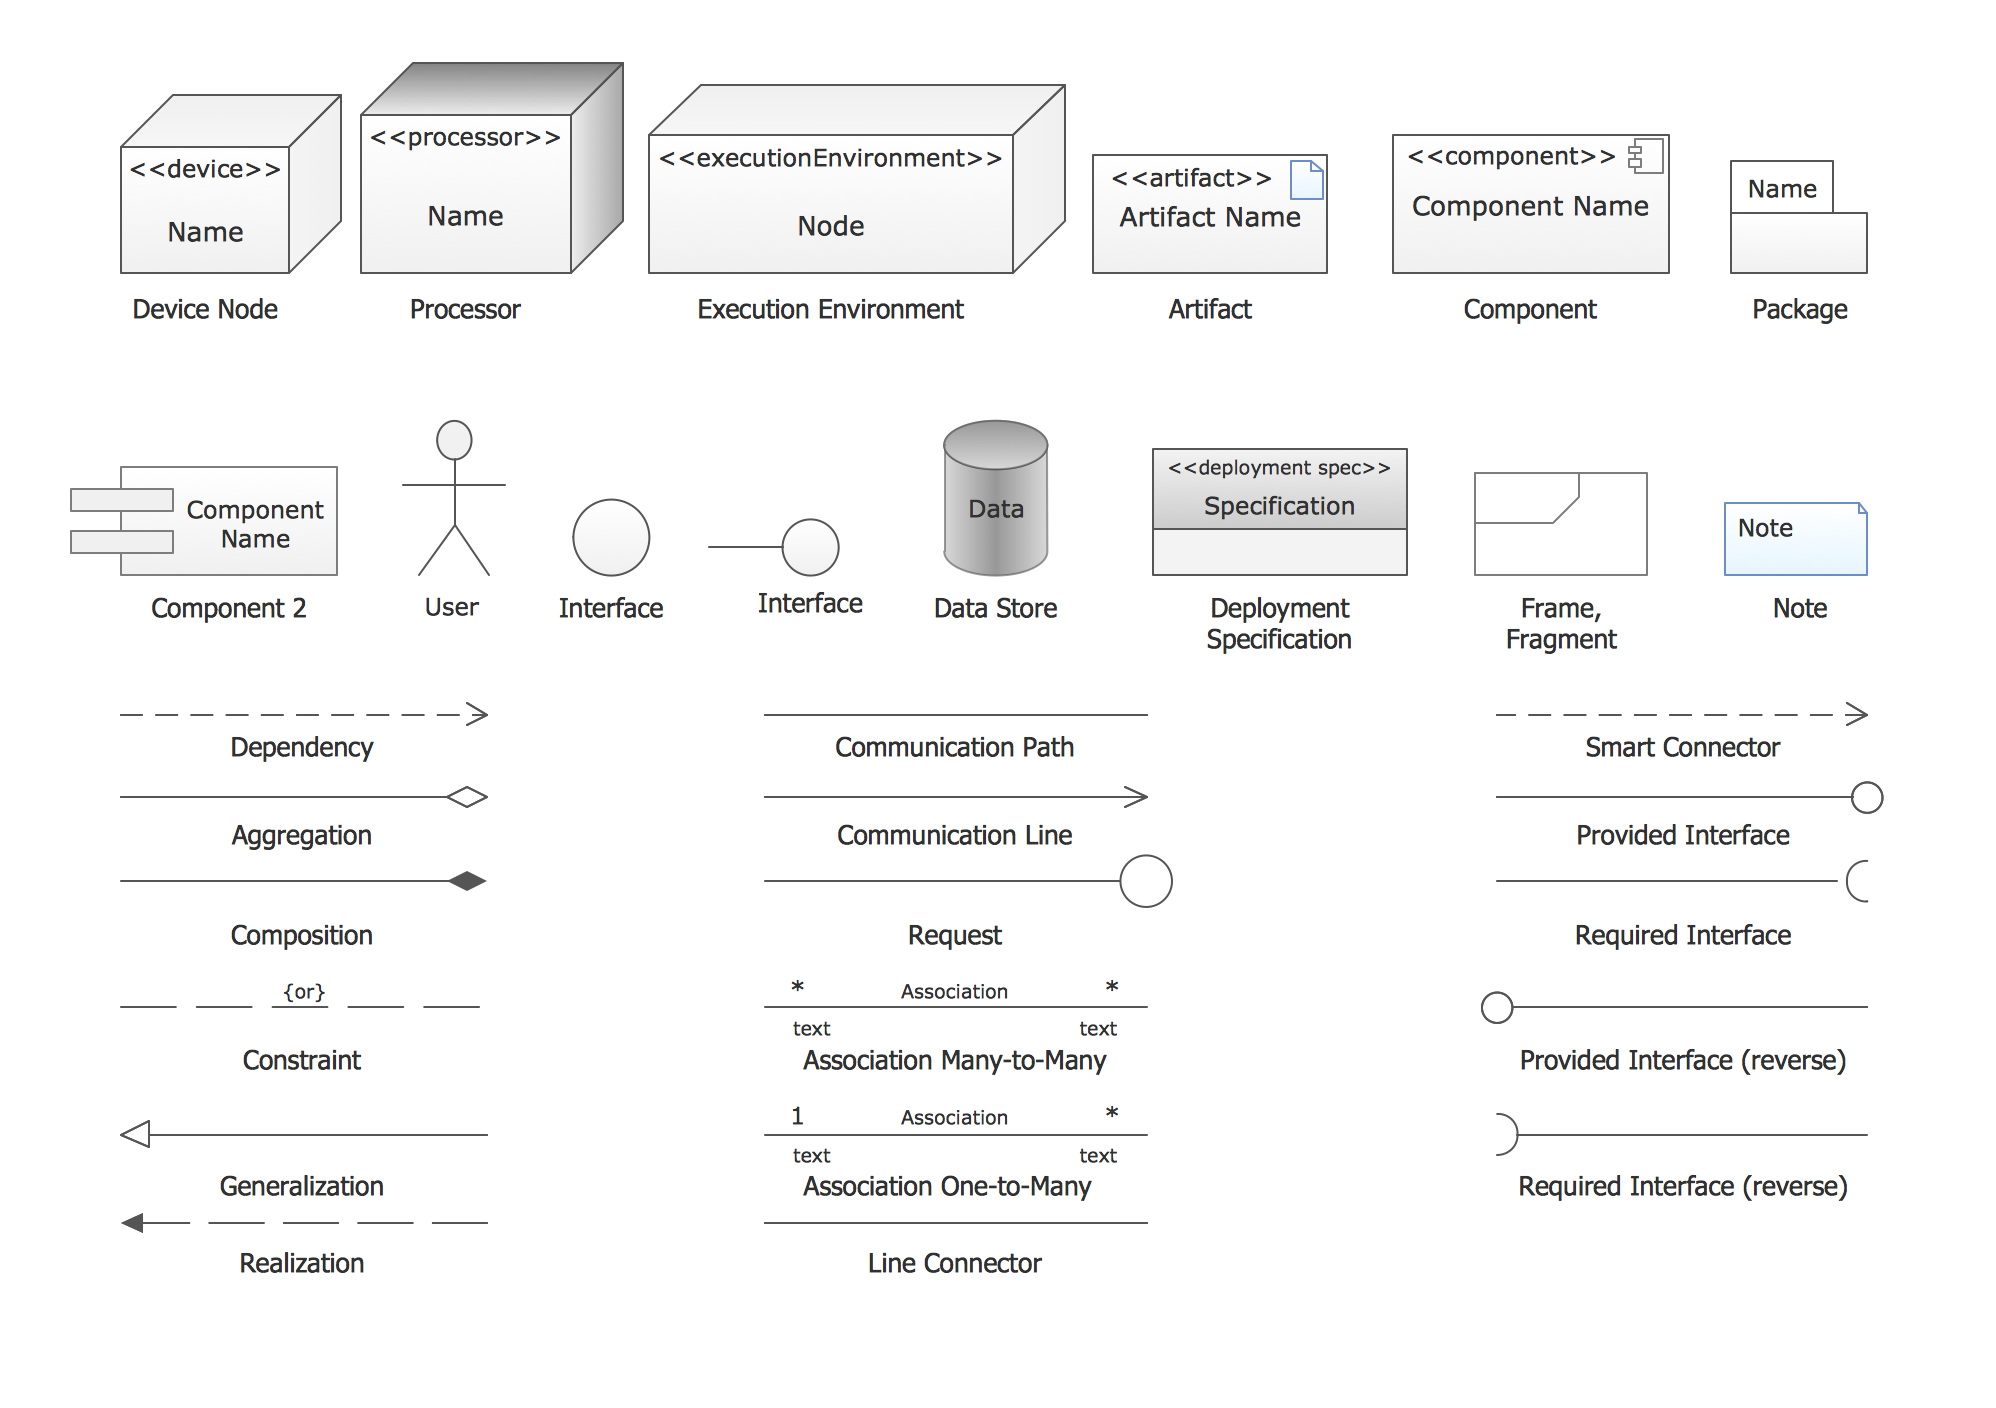
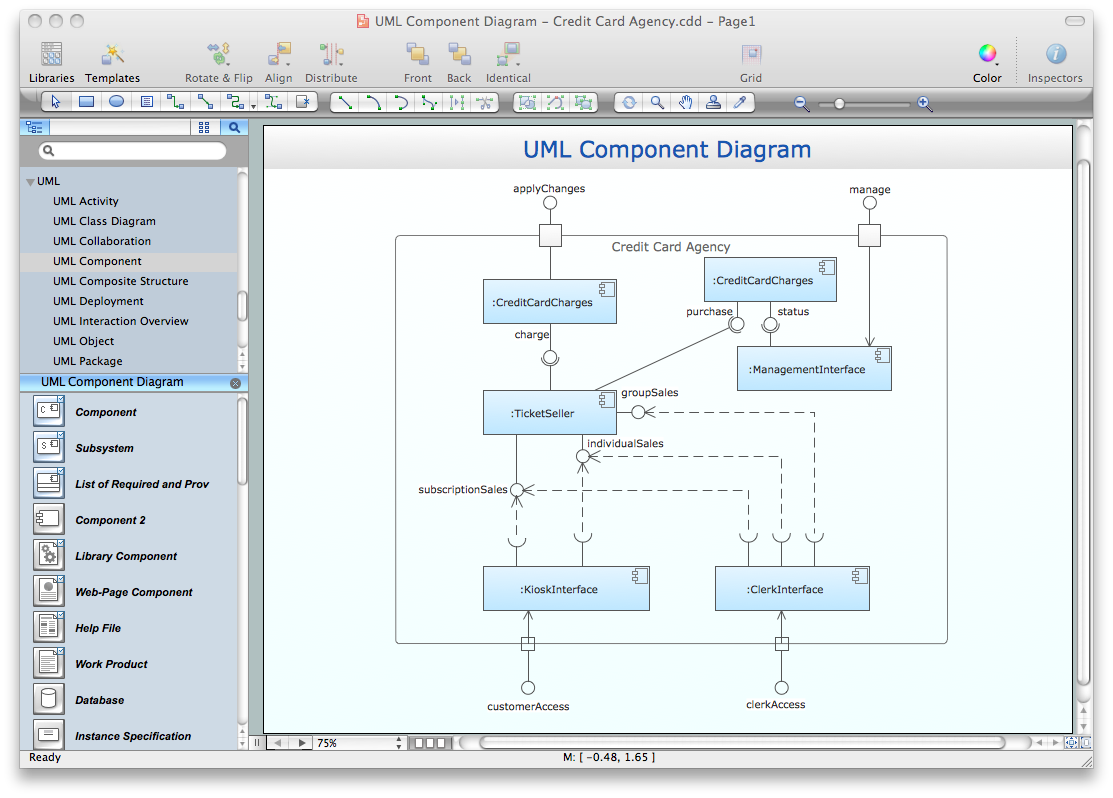
Component Diagrams
"In the Unified Modeling Language, a component diagram depicts how components are wired together to form larger components and or software systems. They are used to illustrate the structure of arbitrarily complex systems."
[Component diagram. Wikipedia]
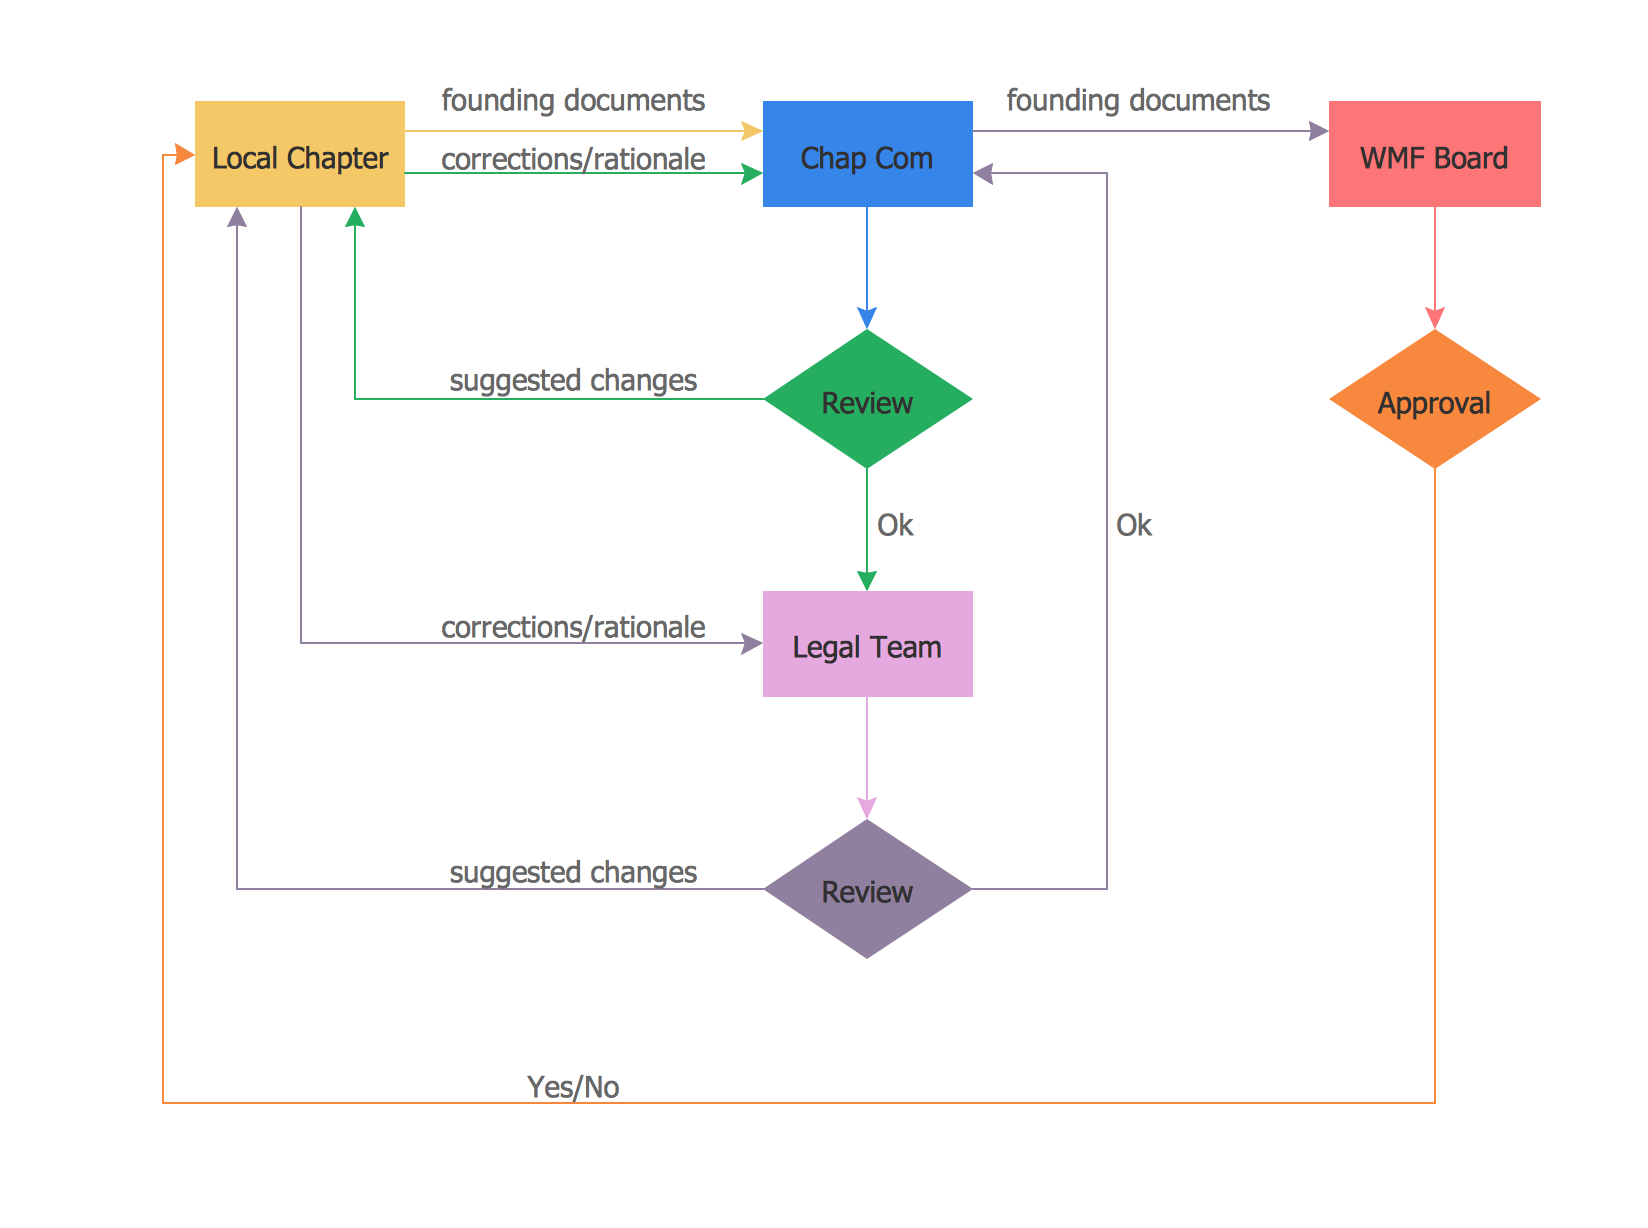
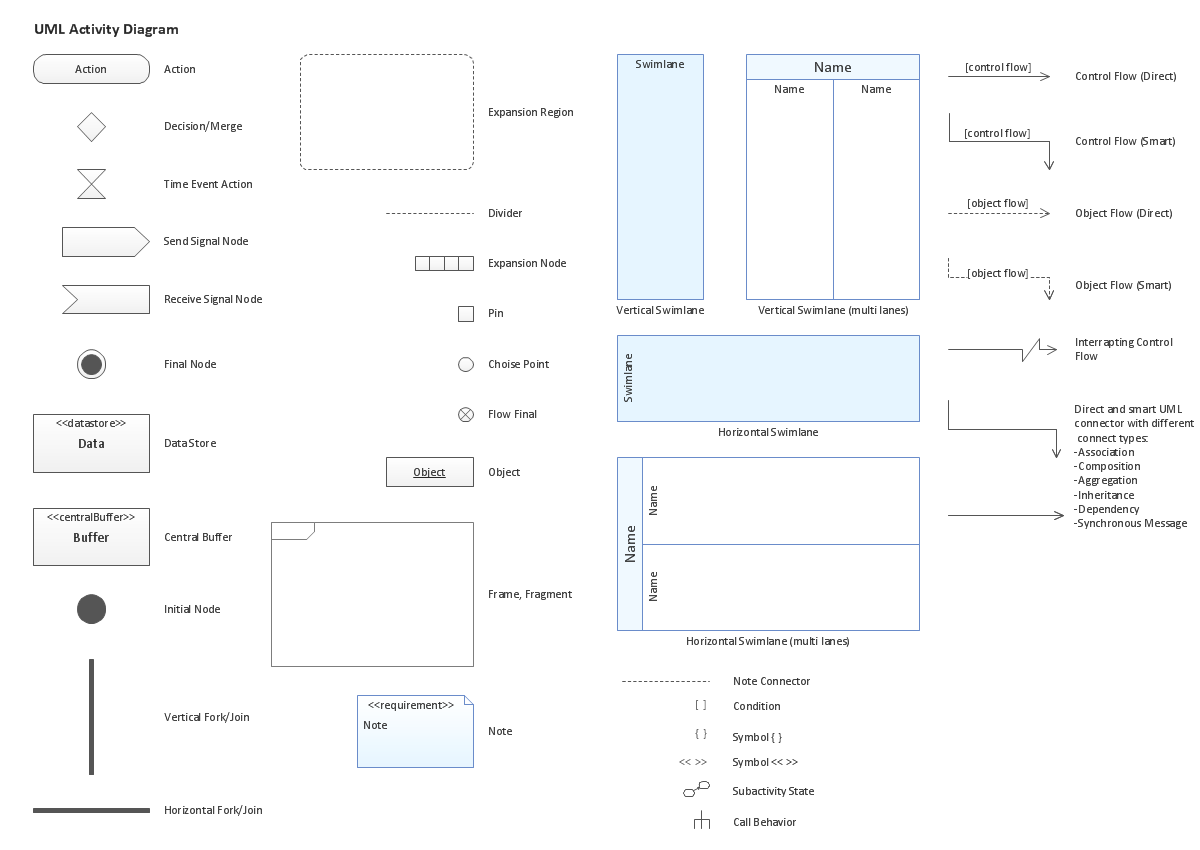
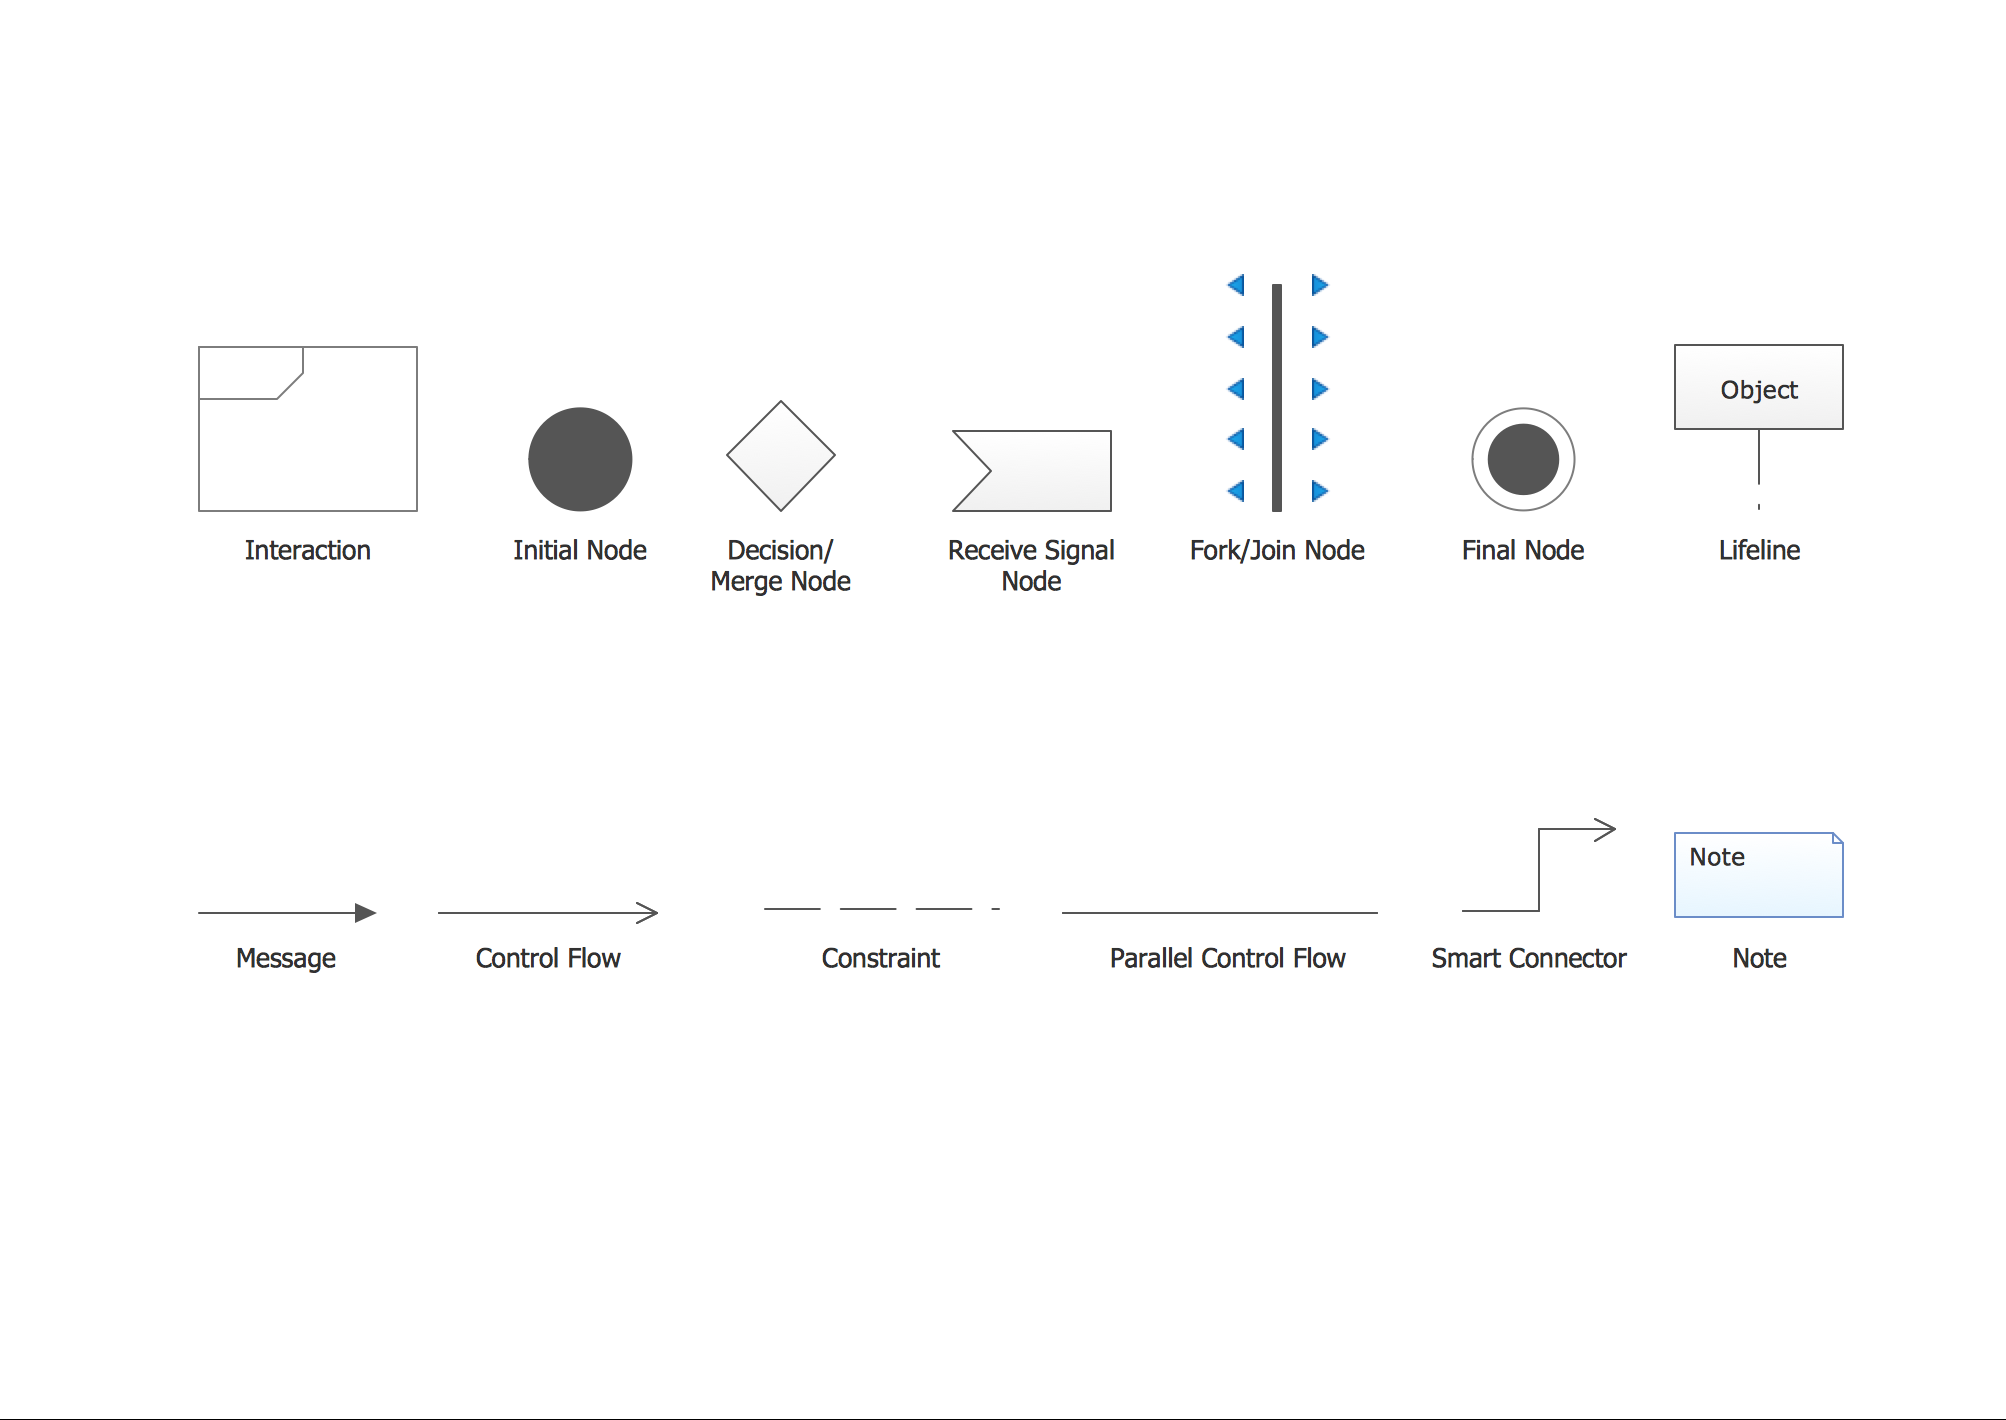
Activity Diagrams
"Activity diagrams are graphical representations of workflows of stepwise activities and actions with support for choice, iteration and concurrency. In the Unified Modeling Language, activity diagrams are intended to model both computational and organisational processes (i.e. workflows). Activity diagrams show the overall flow of control."
[Activity diagram. Wikipedia]
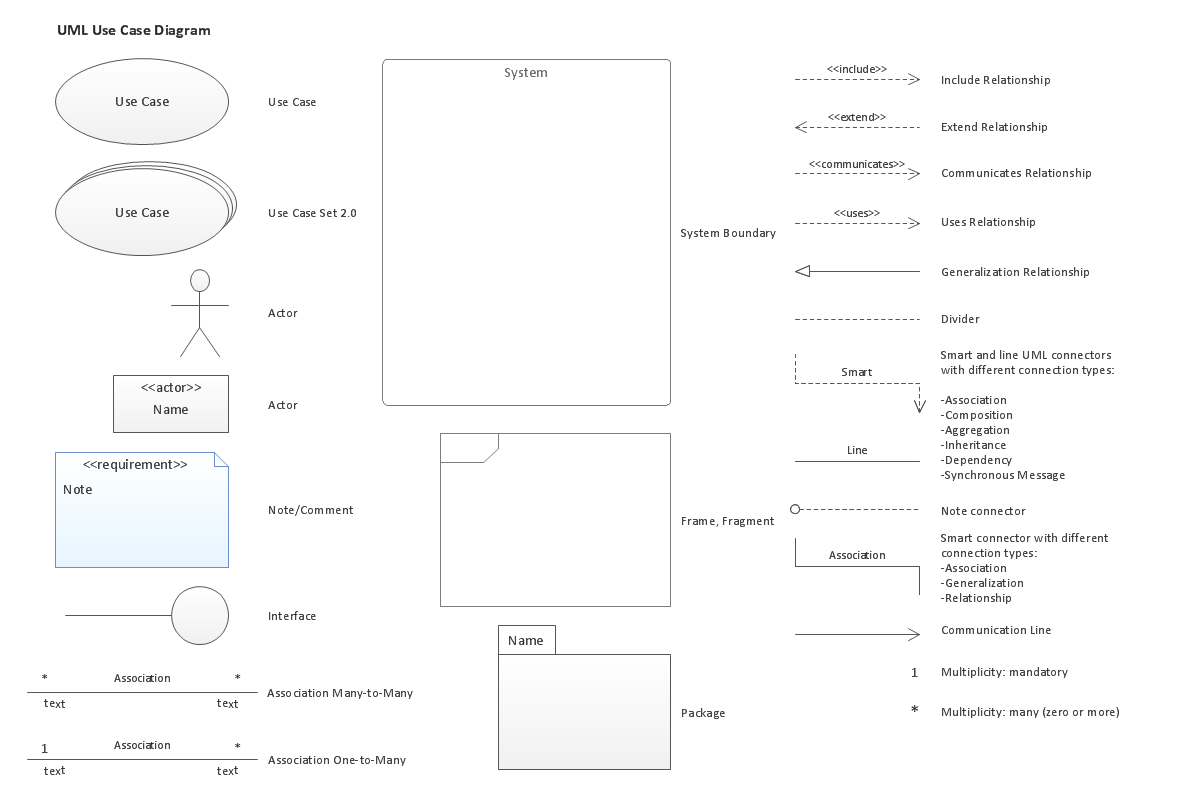
Use Case Diagrams
"A use case diagram at its simplest is a representation of a user's interaction with the system and depicting the specifications of a use case. A use case diagram can portray the different types of users of a system and the various ways that they interact with the system. This type of diagram is typically used in conjunction with the textual use case and will often be accompanied by other types of diagrams as well."
[Use Case Diagram. Wikipedia]
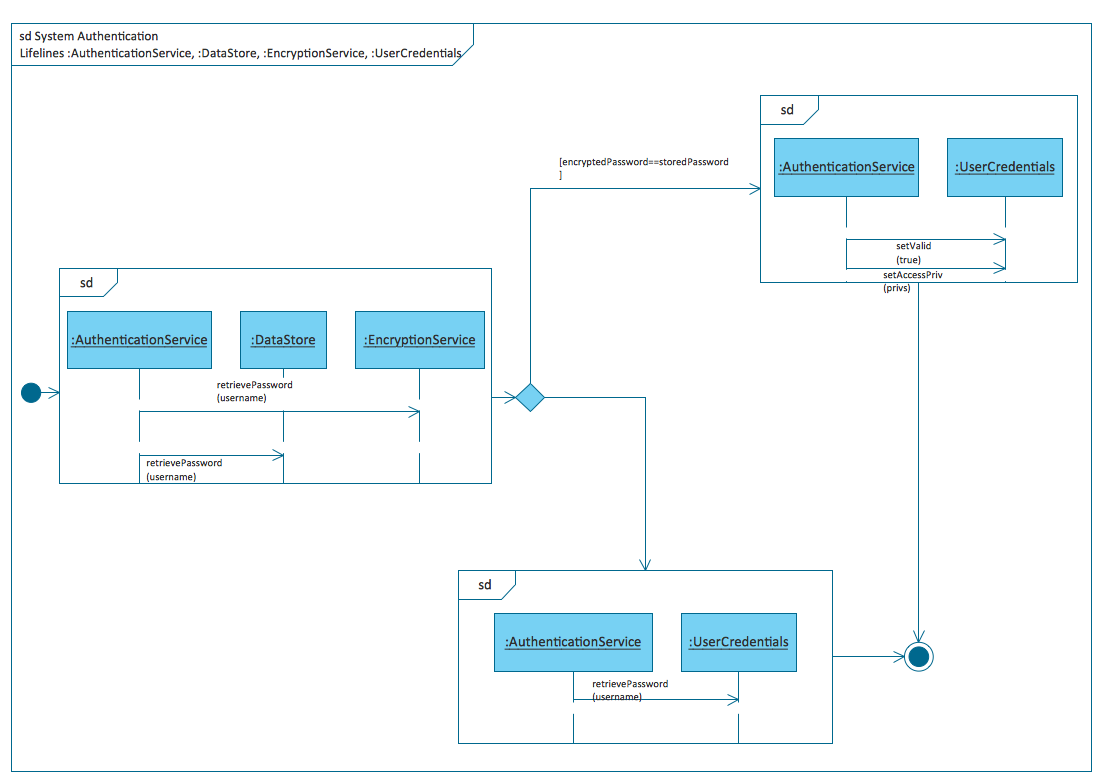
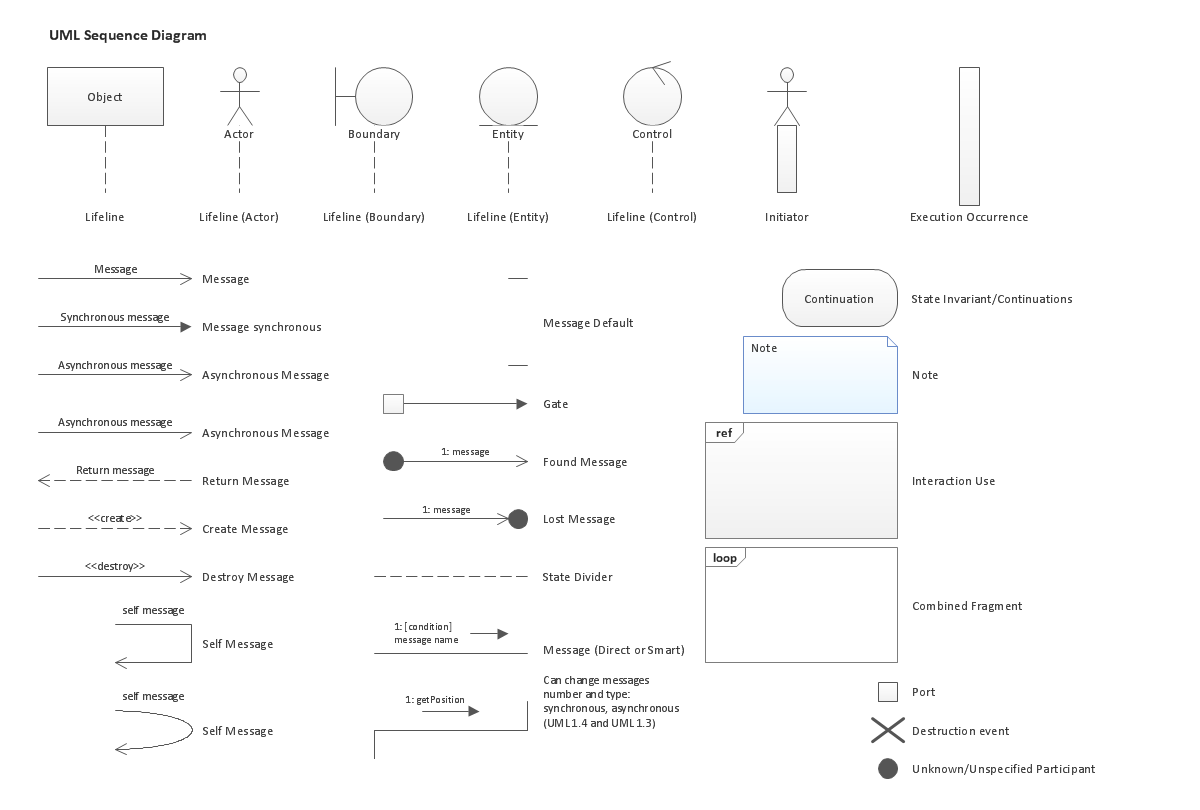
Sequence Diagrams
"A sequence diagram is a interaction diagram that shows how processes operate with one another and in what order. It is a construct of a Message Sequence Chart. A sequence diagram shows object interactions arranged in time sequence. It depicts the objects and classes involved in the scenario and the sequence of messages exchanged between the objects needed to carry out the functionality of the scenario. Sequence diagrams are typically associated with use case realizations in the Logical View of the system under development. Sequence diagrams are sometimes called event diagrams, event scenarios.
A sequence diagram shows, as parallel vertical lines (lifelines), different processes or objects that live simultaneously, and, as horizontal arrows, the messages exchanged between them, in the order in which they occur. This allows the specification of simple runtime scenarios in a graphical manner."
[Sequence diagram. Wikipedia]
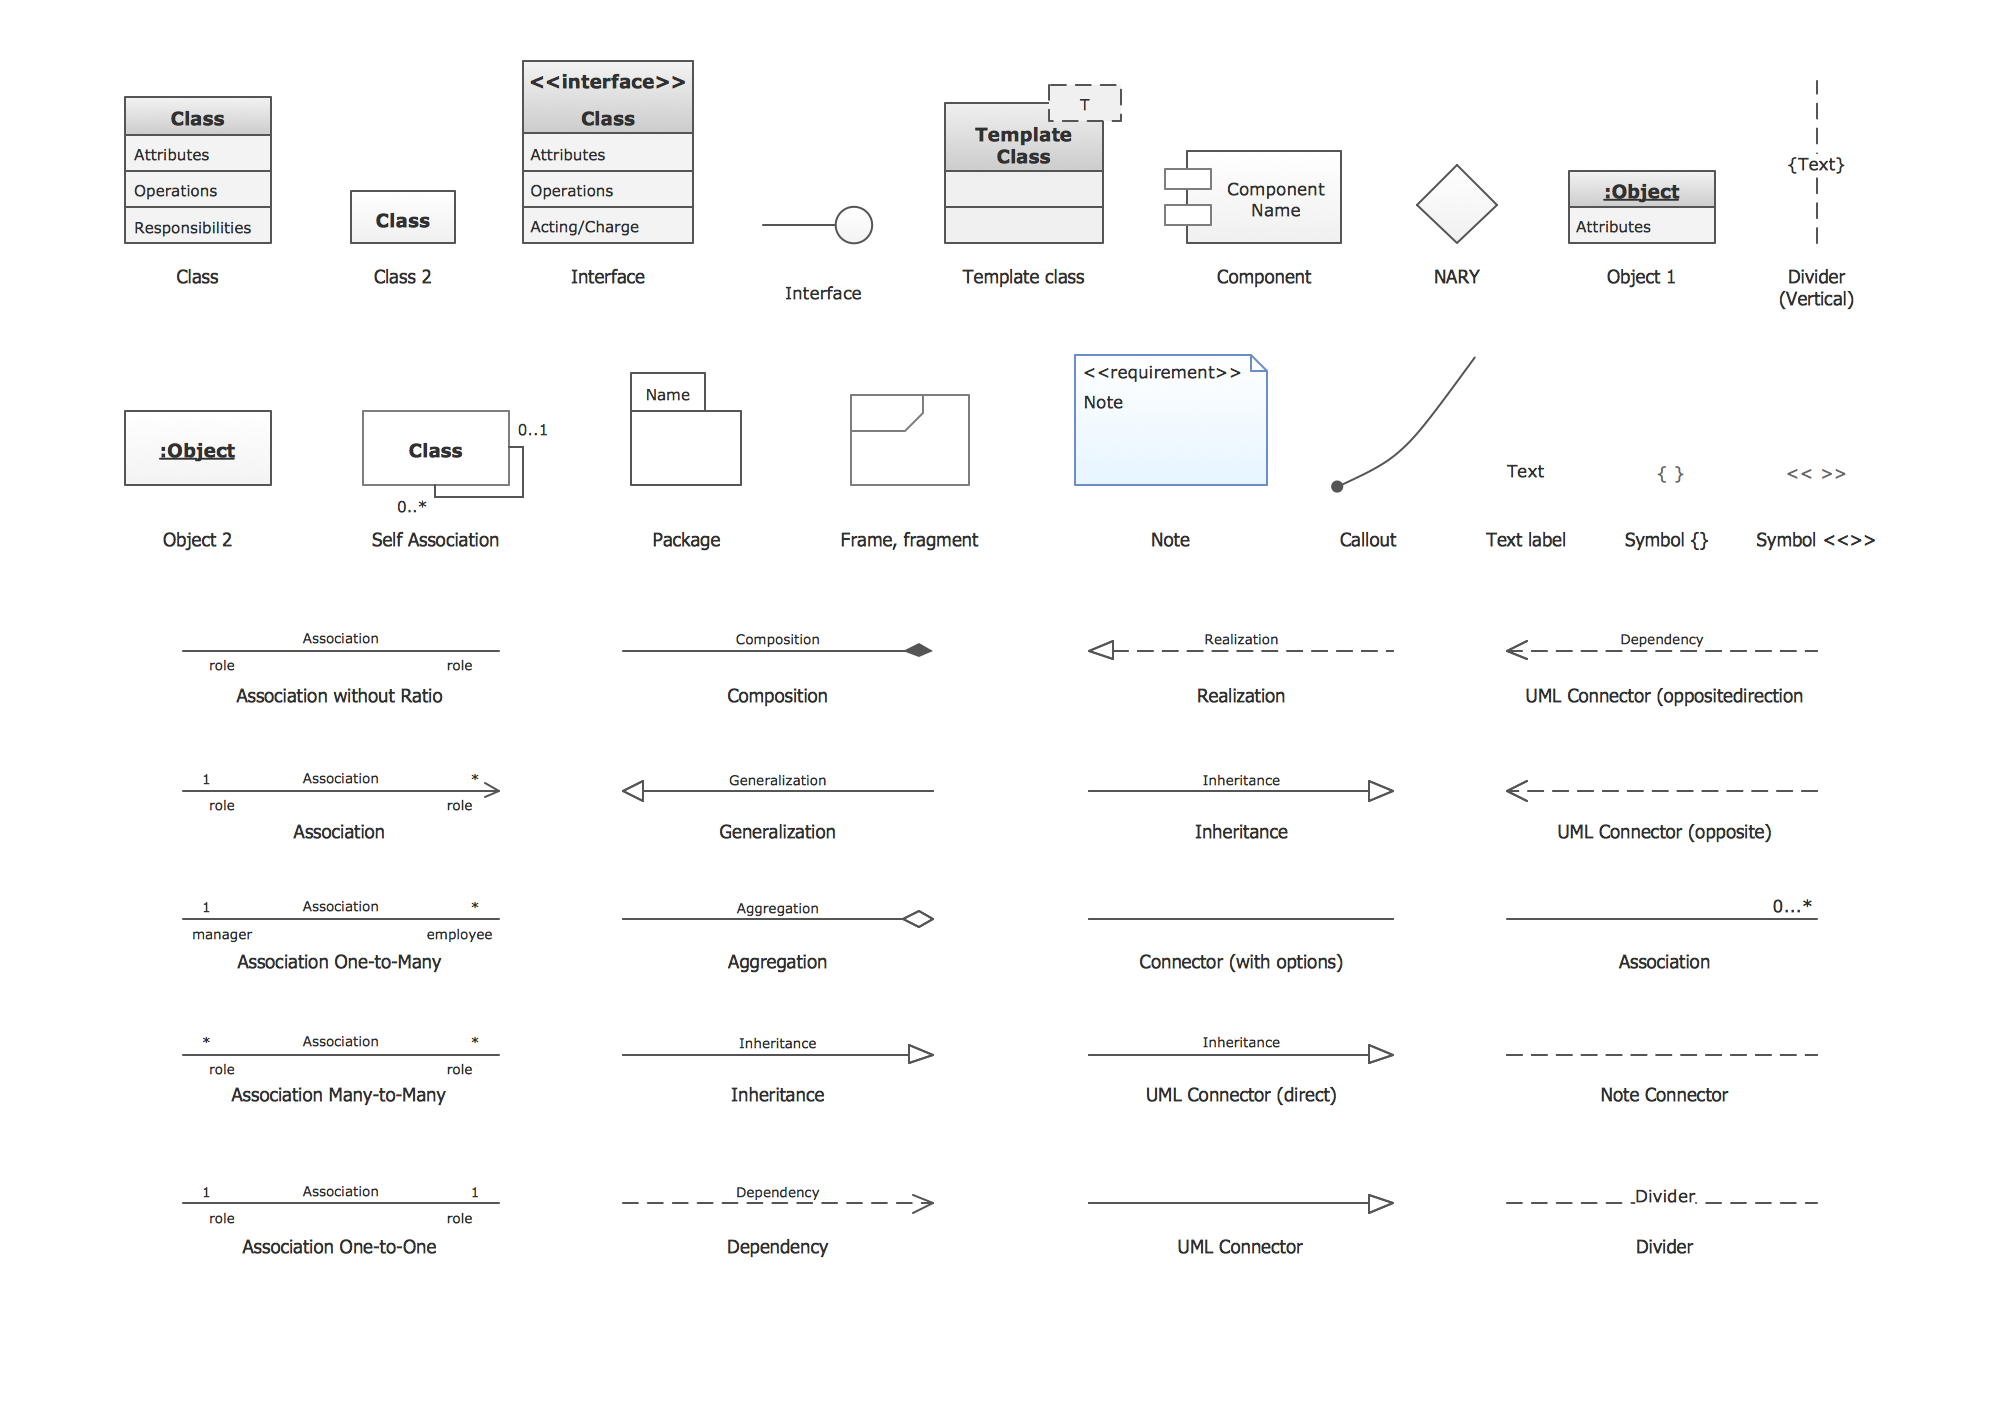
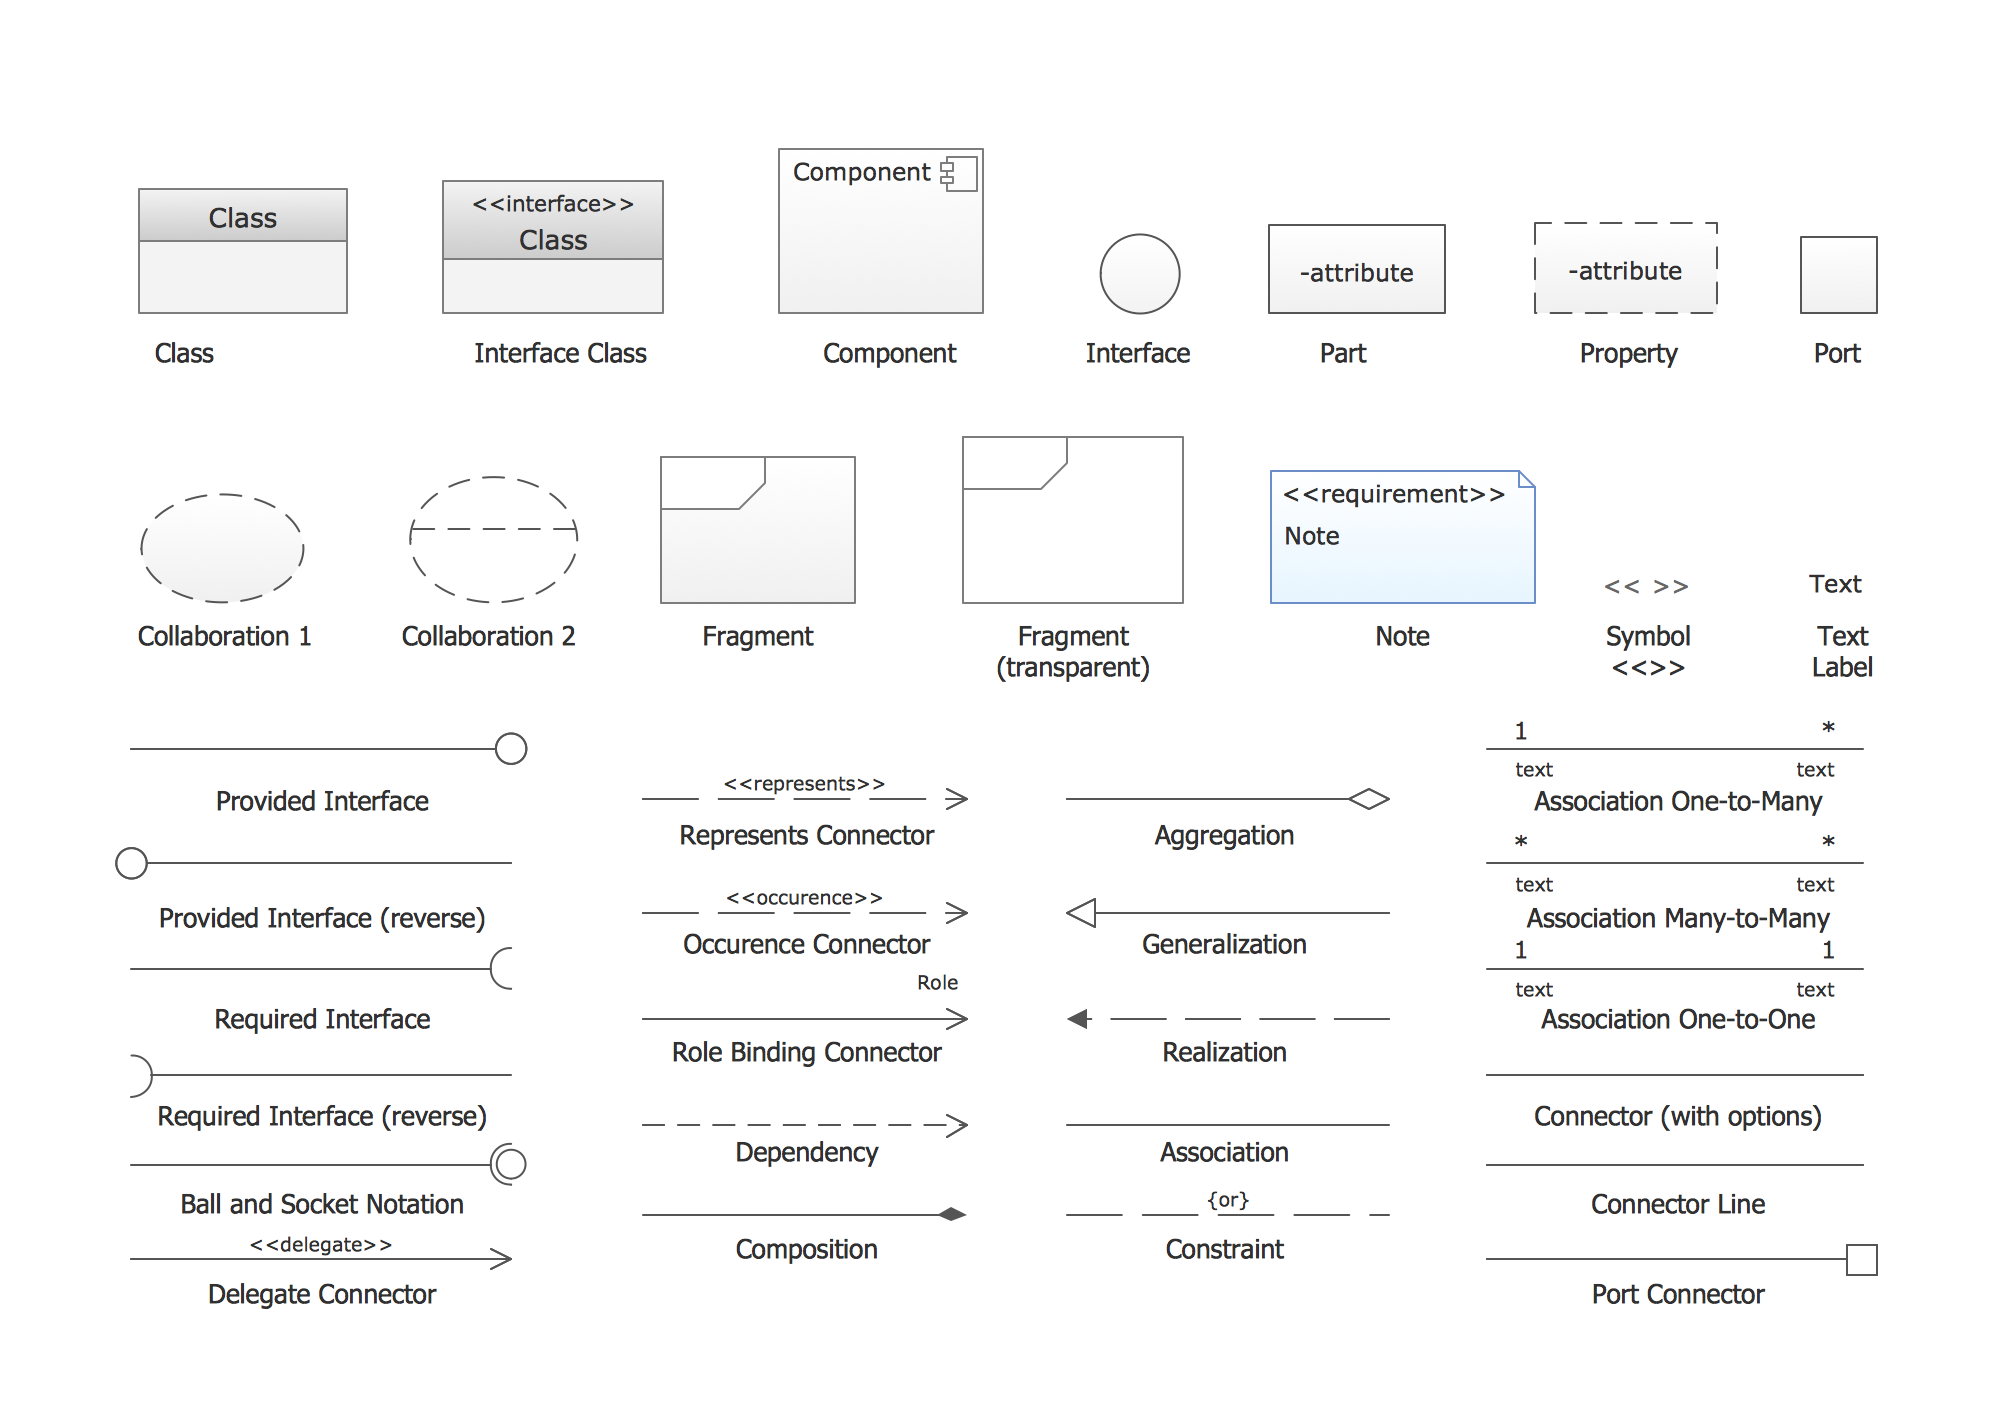
UML Class Diagrams
UML Class Diagrams describes the structure of a system by showing the system's classes, their attributes, and the relationships among the classes.
UML Package Diagrams
UML Package Diagram illustrates the functionality of a software system.

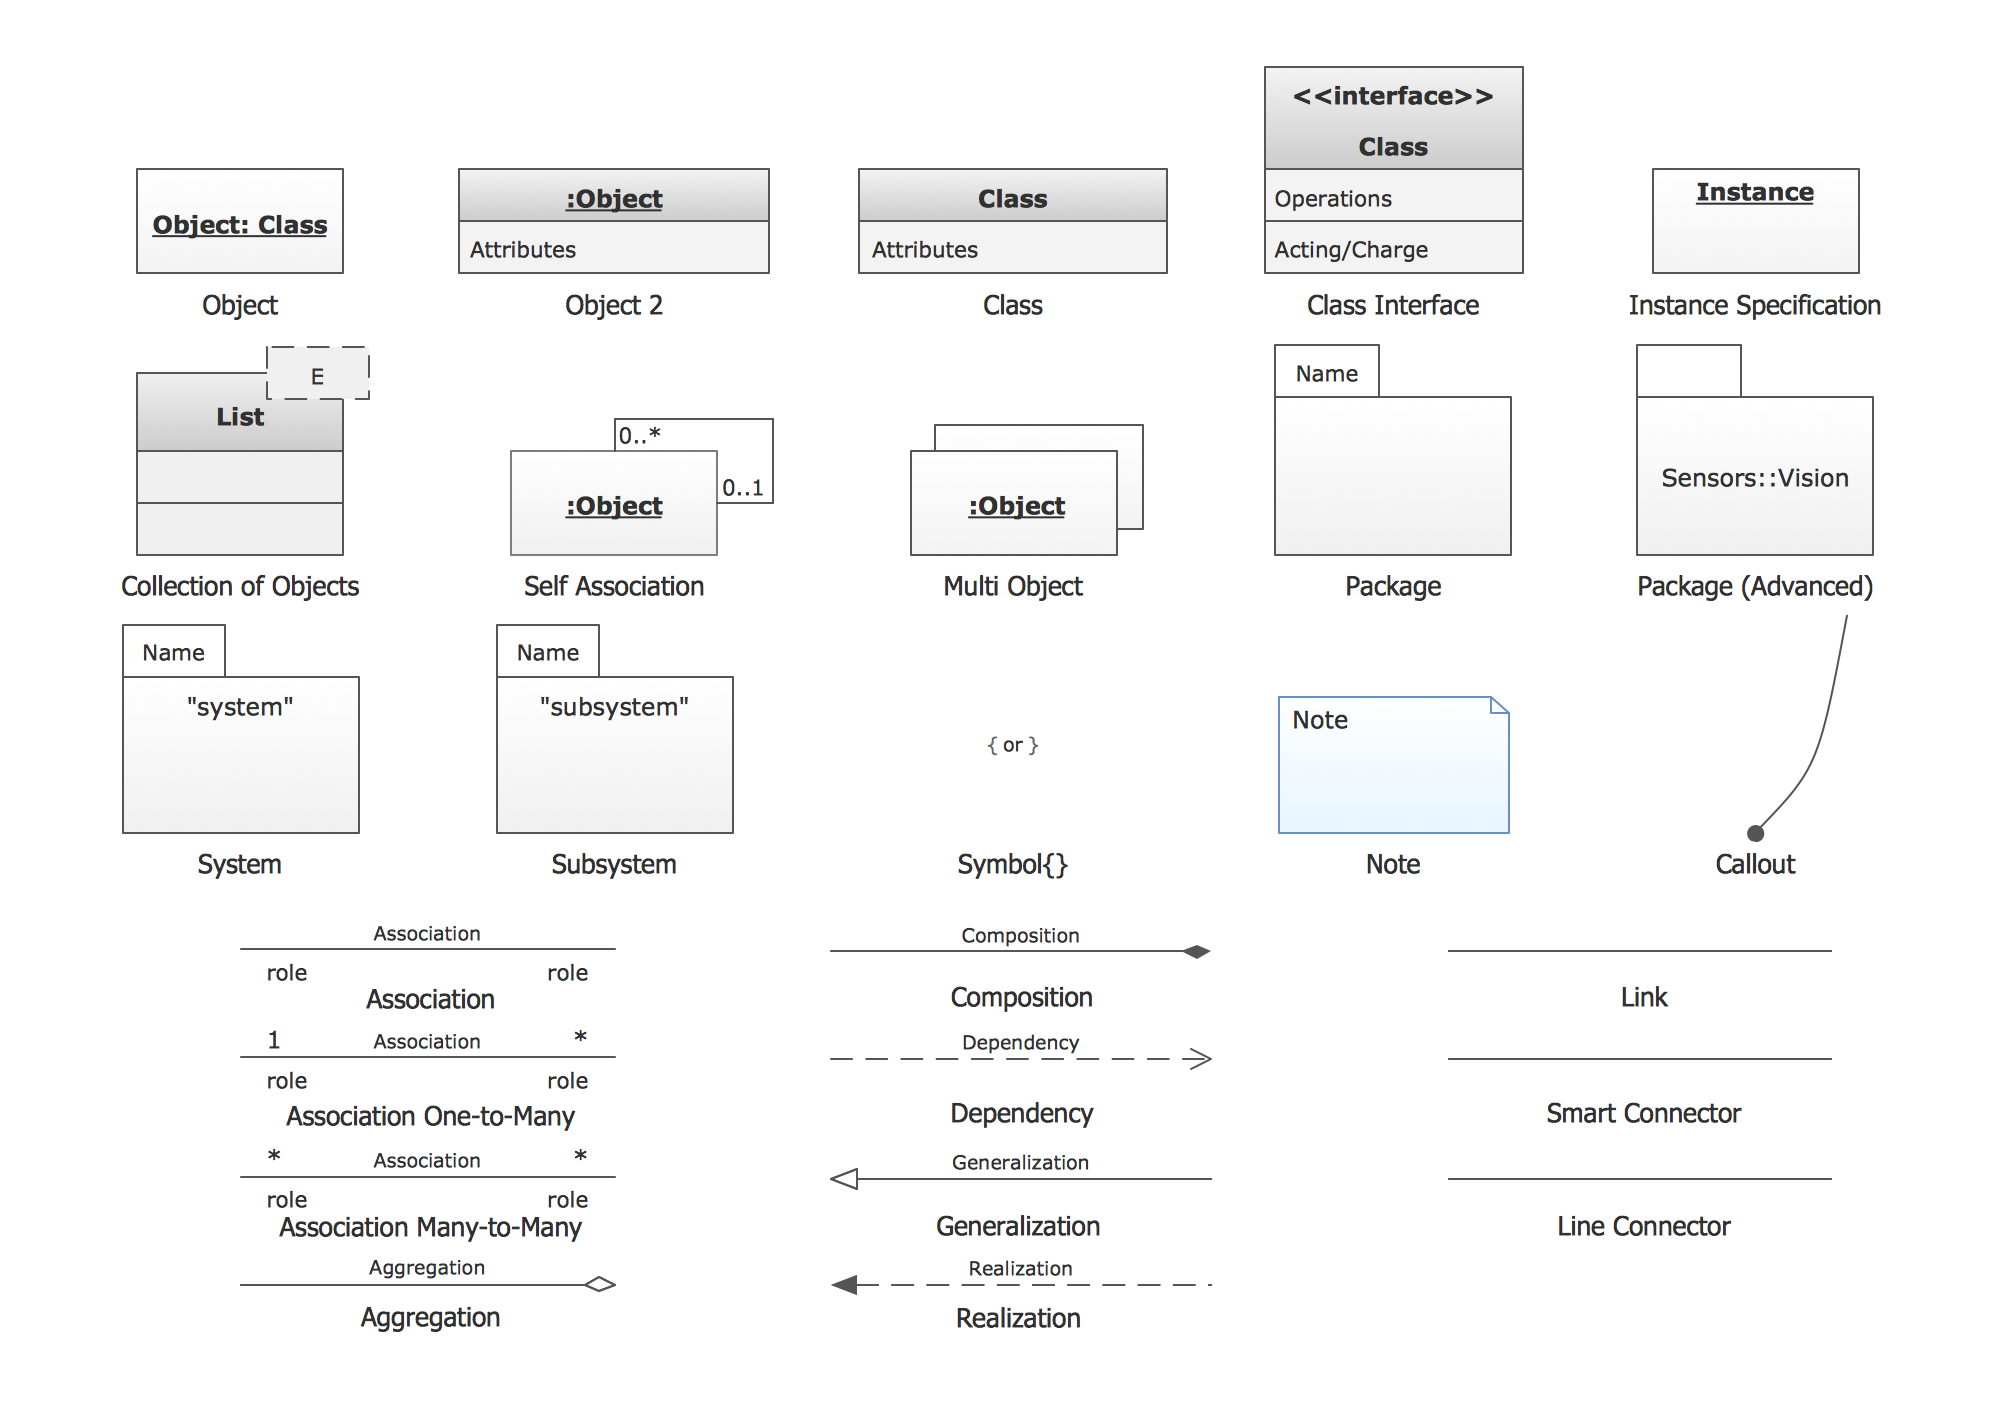
UML Object Diagrams
UML UML Object Diagram shows the structure of a modeled system at a specific time.
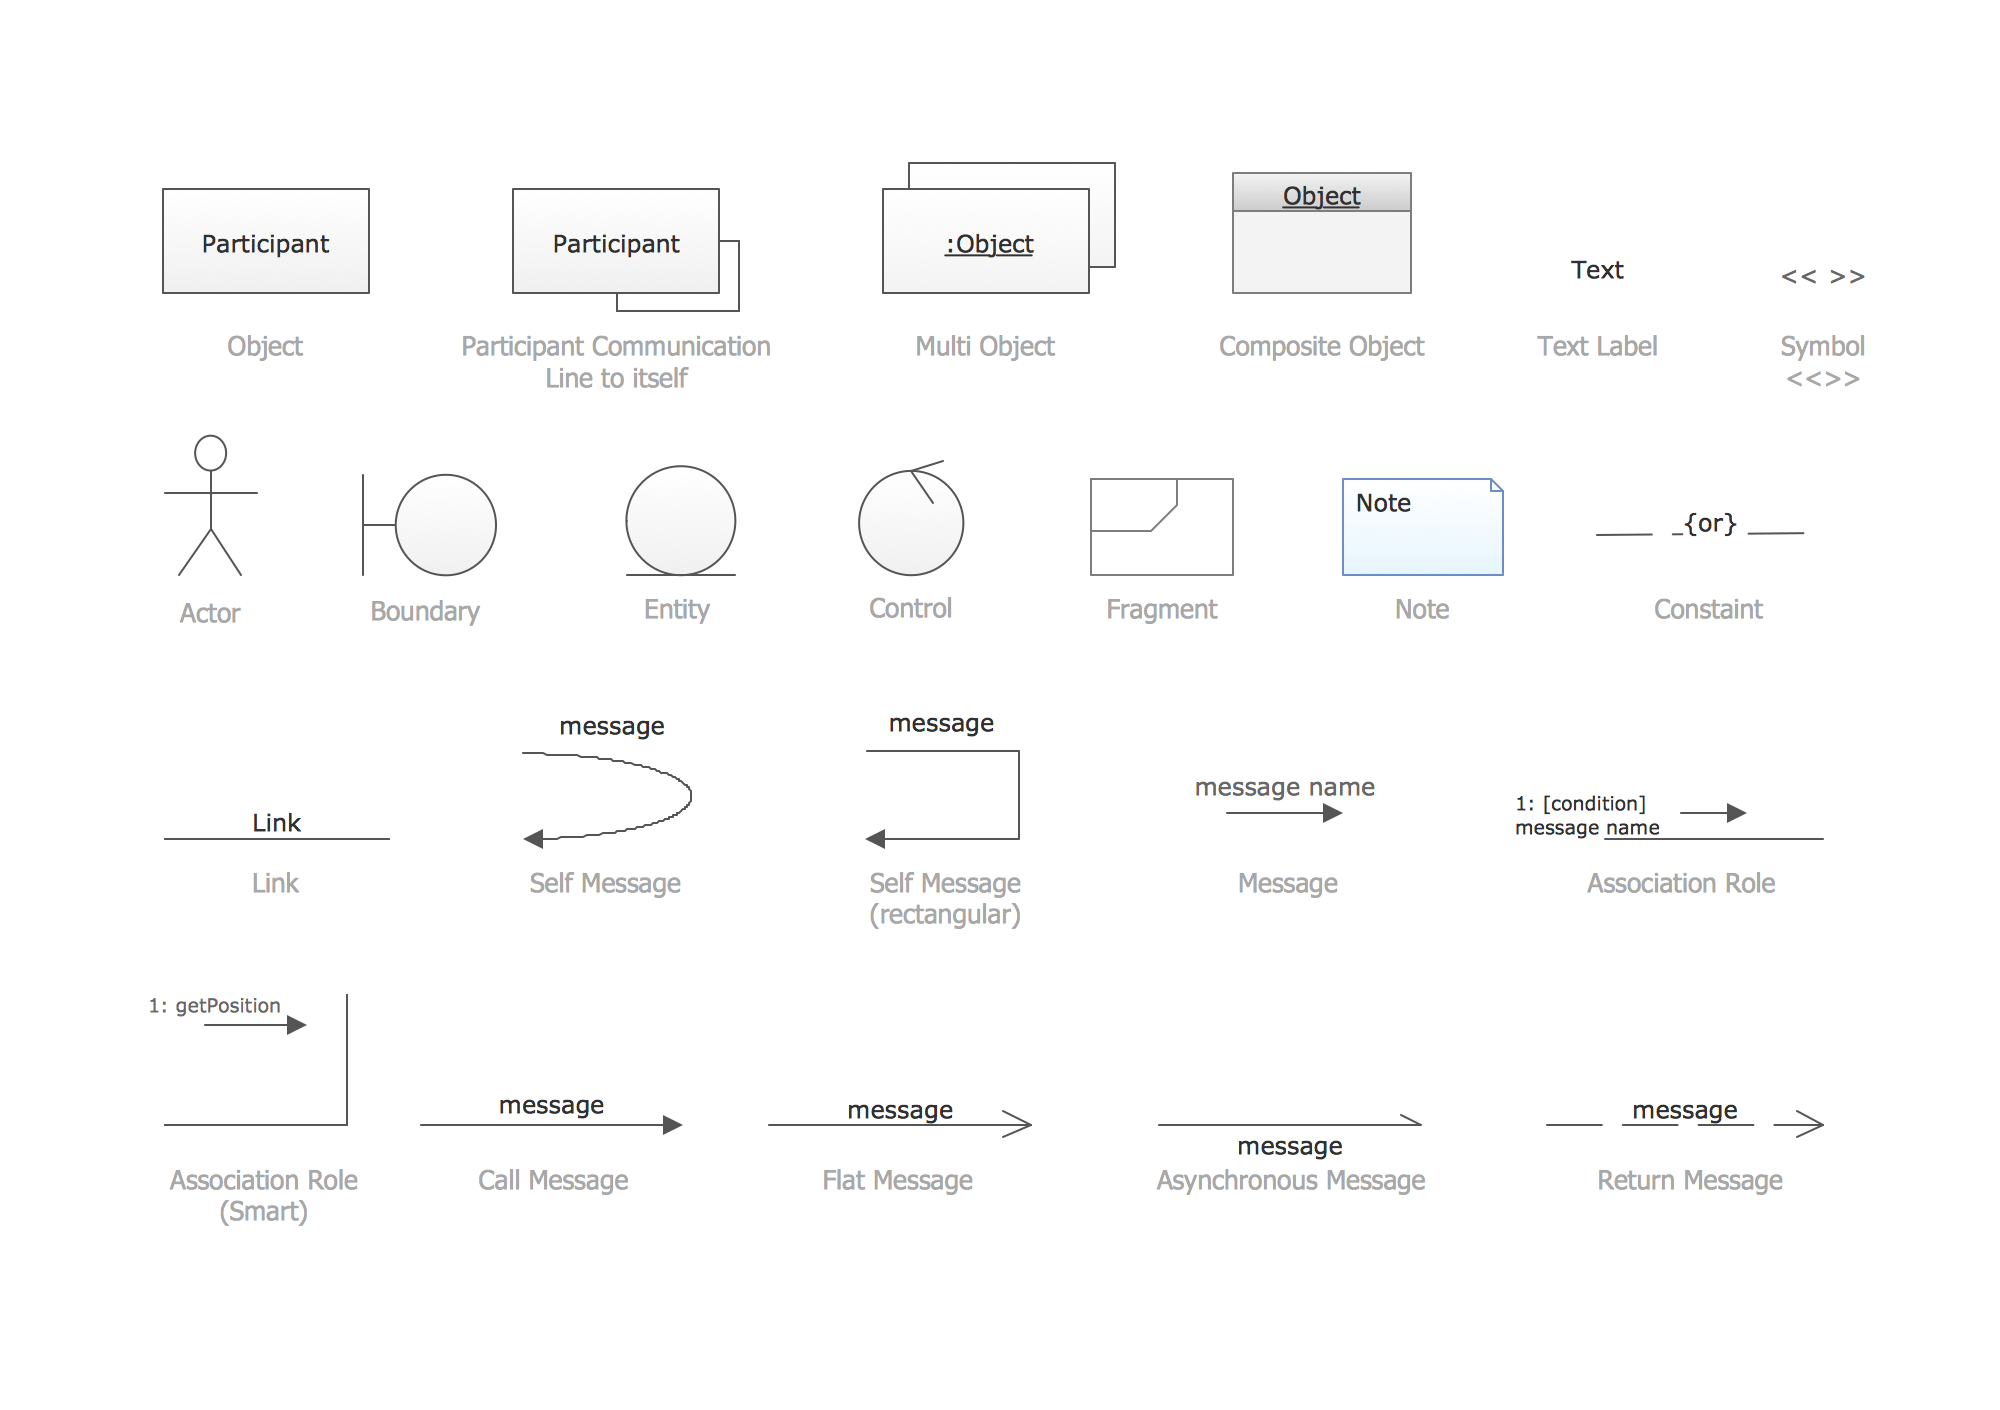
UML Collaboration Diagrams
UML Collaboration Diagram depicts the interactions between objects or parts in terms of sequenced messages and describes both the static structure and dynamic behavior of a system.
UML Deployment Diagrams
Deployment diagram describes the hardware used in system implementations and the execution environments and artifacts deployed on the hardware.
UML State Machine Diagrams
UML state machine's goal is to overcome the main limitations of traditional finite-state machines while retaining their main benefits.
UML Timing Diagrams
UML Timing Diagram as special form of a sequence diagram are used to explore the behaviors of objects throughout a given period of time.

UML Interaction Overview Diagrams
UML Interaction Overview Diagram schematically shows a control flow with nodes and a sequence of activities that can contain interaction or sequence diagrams.
UML Composite Structure Diagrams
UML Composite Structure Diagram shows the internal structure of a class and the possible interactions at this structure.
How to Create a UML Diagram
The ConceptDraw Rapid UML solution provides a set of special tools for creating UML diagrams. Run the ConceptDraw STORE, select the Rapid UML Diagrams solution and click “Install”.
- Open a ConceptDraw DIAGRAM new document and select the appropriate UML library.
- Add your first object to the page.
- Add the next object by clicking on its icon from the RapidDraw arrows that pop up when you bring the mouse cursor over the object.
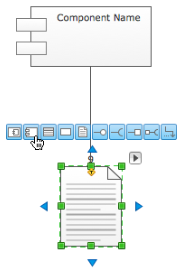
- The new objects will be automatically drawn and connected to the previous ones.
Result:Using the RapidDraw technology to create diagrams allows you to make very complex diagrams quickly and easily.
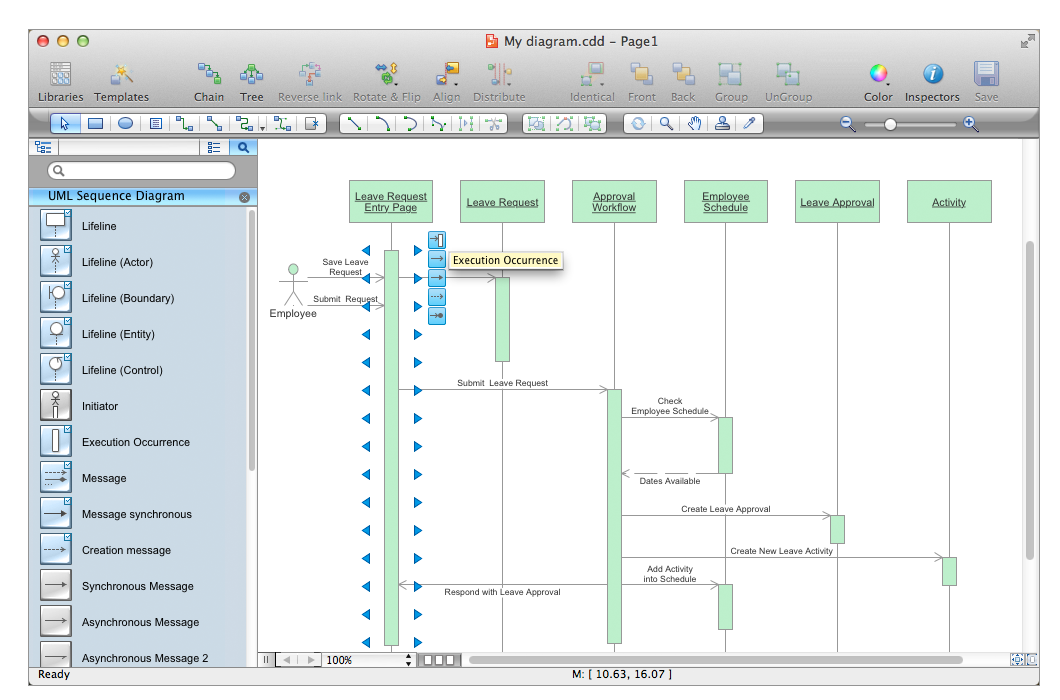
Pic. 1. UML Sequence Sample
All libraries for creating UML diagrams are available inside the ConceptDraw DIAGRAM Templates and samples are located in the Rapid UML section of ConceptDraw STORE.

Pic. 2. UML Diagrams solution