Pyramid Chart Examples
Pyramid and triangular diagrams
There are very many different types of diagrams, which all can be illustrated with the help of ConceptDraw DIAGRAM software. Having this unique application means enabling yourself to create only professionally looking as well as smart diagrams, including the pyramid ones. Thus, the pyramid diagrams and charts all can be created with the aid of ConceptDraw DIAGRAM software within only a couple of hours or even minutes and they all can be used for visualizing the hierarchical structure of topics as well as the progressively ordered quantitative data. The triangular diagrams can be used to visualize the containment, proportional, hierarchical and/or interconnected relations between the labelled topics. The multilevel pyramid as well as the triangle diagrams are meant to be divided into the horizontal slices and they always can be oriented up or down, depending on what exactly you want to show and explain using them.
The pyramid and triangular diagrams always can be created in ConceptDraw DIAGRAM software with the help of the needed solution from ConceptDraw STORE as well as to simply download this solution from this site. Such types of diagrams all can be used for illustrating the needed information, which can be used in the documents, to fill the content of your websites as well as for presentations in different spheres of business, such as finances, media, management, sales or marketing, training or consulting.
The solution, which can be the most appropriate for creating such diagrams is a “Pyramid Diagrams solution”. It can be found in the “Marketing area” of “ConceptDraw Solution Park” and it contains a set of examples, templates and vector design elements of both pyramid and triangular diagrams. This solution will be useful for you while you are working in ConceptDraw DIAGRAM creating the pyramid and/or triangular diagrams as you can always use the existing pre-made samples as your drafts for getting the best looking as well as a professional and smart result.
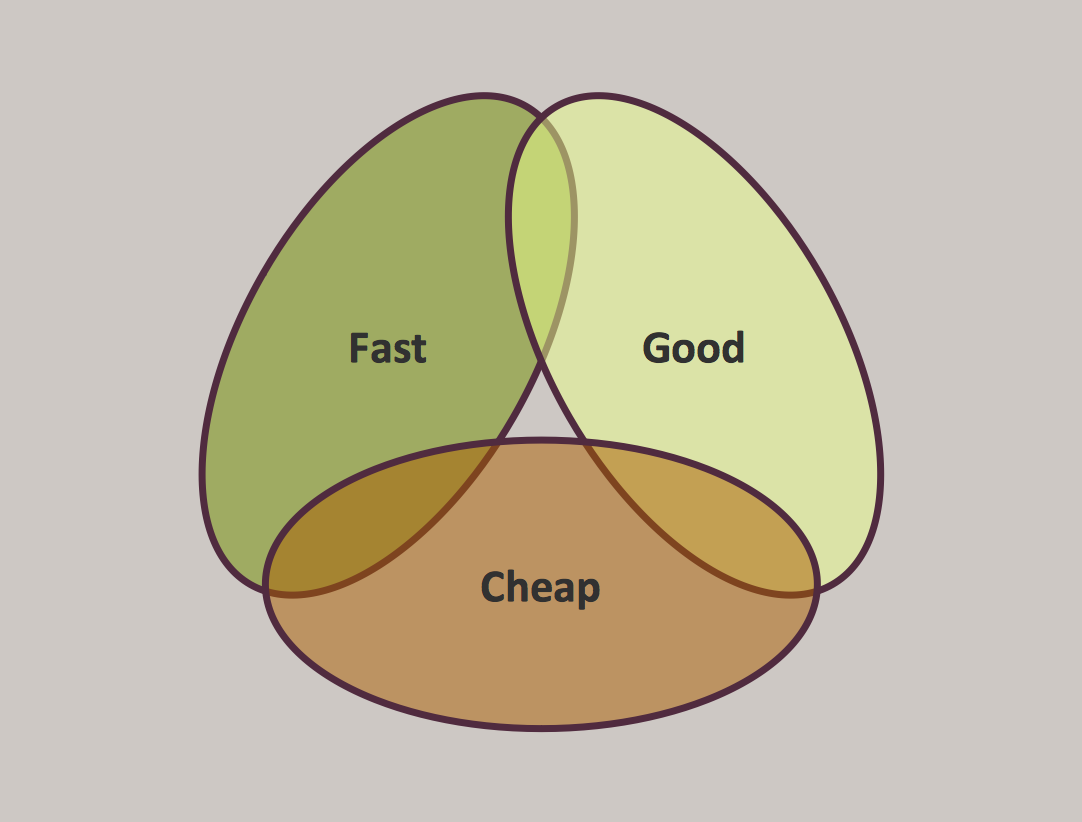
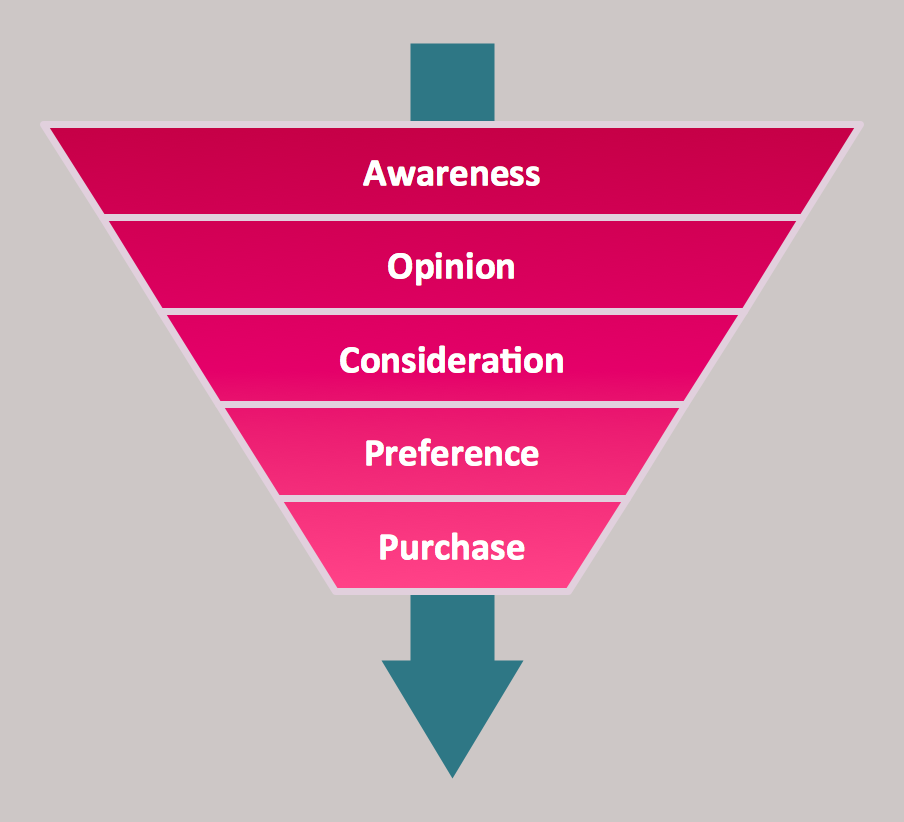
The other kinds of diagrams as well as their descriptions can be also found on this site and so can be created in ConceptDraw DIAGRAM Thus, you can always draw a Zooko Triangle Diagram, a Time, Quality, Money Triangle Diagram, any Project Triangle Diagram or Purchase Funnel Diagram. If needed, there are charts as well, which always can be made within maximum a couple of hours using ConceptDraw DIAGRAM such as Project Triangle Chart. Although, it always depends on how familiar you are with the ConceptDraw DIAGRAM but usually creating a Priority Pyramid Diagram, Organization Triangle Diagram, Knowledge Triangle Diagram, Triangular Graphic diagram, Inverted Pyramid or Fundraising Pyramid takes only a few hours. You can also make a great looking 3D Triangle Diagram as well as DIKW Pyramid and any needed models with as many levels as you need them to be, such as Five level pyramid model, Four level pyramid model or Three level pyramid model.


Top brand model pyramid diagram
Nowadays, it is also very popular to make the top brand model pyramid diagrams, which can be illustrated in order to show the brand’s special features. To be more clear, it is fair to mention what actually a brand is. Thus, a brand is a name, symbol, term, design or other feature, with the help of which it is easier to distinguish an organization or product from the competitors, so it is clear that some product or service can be offered by a particular company. Brands can be used in many different kinds of business activity, including advertising and marketing.
“Branding” itself is a set of both communication and marketing methods that help distinguish some product of a company or a company itself from its competitors. The key components, forming a brand's toolbox include a brand communication with the aid of trademarks and logos, brand awareness, brand’s identity, loyalty and many different branding strategies, which all belong to the classification of management known as “brand management”.
Brand awareness is also known as a “brand recognition” and it can be described as the initial phase of the brand awareness, validating whether or not a customer remembers being pre-exposed to the brand. When customers experience brand awareness, that means they are intrigued by the product and so they intend to recognise it among other brands. Apart from the brand awareness, there is another term, which is an important constituent in “brand management” - a “brand recall”. This “brand recall” is not triggered by a visual or verbal cue, but it requires that the consumers correctly retrieve the brand from memory. Those, who are in charge for the company’s marketing activity to be working for the company, are known to be the “brand managers”. These professional specialists often arrange the surveys, offering people to tell if they like their branding or not, paying money for answering the questions about whether the appearance of each product is good enough for them, getting the advice in this way to be able to improve the brand itself.
That is why every head of a company, who cares for their reputation as well as the company’s one, tends to invite the marketing specialists, who are in charge of making the product easily recognizable, applying many different tools for improving its branding. In order to conduct the so needed “marketing-mix modelling” to optimize the work of such marketers to find out the way they spend the allotted marketing budgets and so to maximize the impact on brand awareness or on sales, the responsible managers can create the needed charts and diagrams to make it simpler to illustrate the situation the company is in and so the place its brand takes on the market.
Thus, the top brand model pyramid diagrams can be designed using ConceptDraw DIAGRAM diagramming and vector drawing software, which can be downloaded from this site as well as the “Pyramid Diagrams solution” from “Marketing area” of “ConceptDraw Solution Park” on this site.
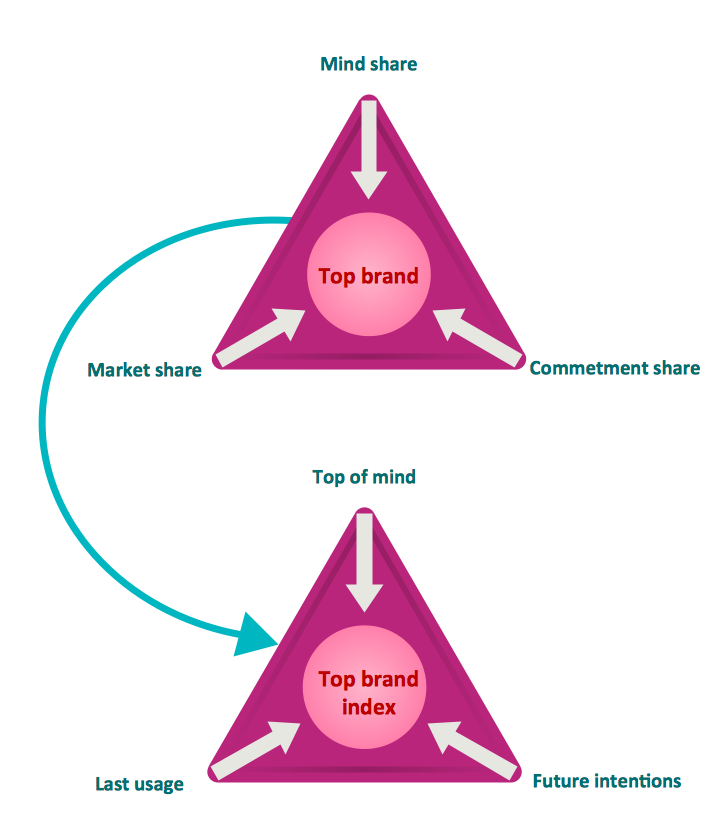
Example 1. Top brand model pyramid diagram
Dna model of seduction Triangular diagram
In colloquial language and fictional literature, seduction is the process of deliberately enticing a person, to lead astray, as from duty, rectitude, or the like; to corrupt, to persuade or induce to engage in sexual behaviour. [Seduction. Wikipedia]
This triangle diagram example is included in the Pyramid Diagrams solution from Marketing area of ConceptDraw Solution Park.
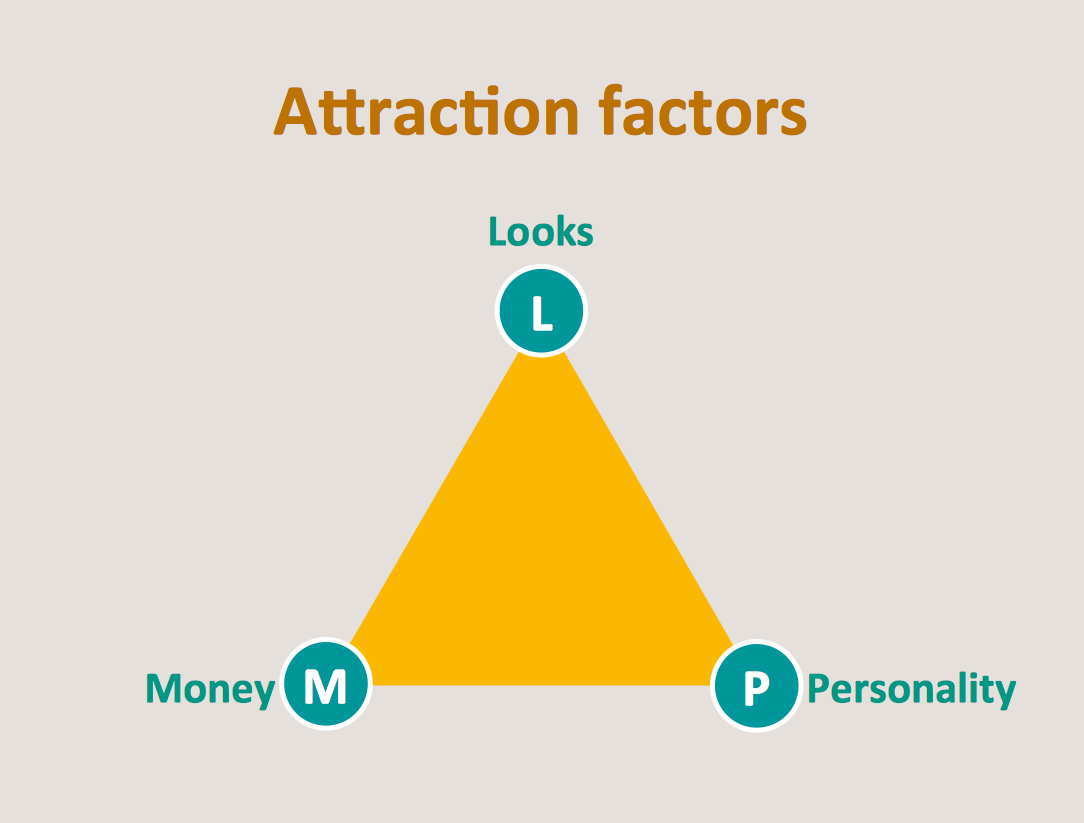
Example 2. Dna model of seduction Triangular diagram
Diagram Social strategy pyramid
This social strategy pyramid diagram has 5 levels: Actions, Distribution strategy, Content strategy, Relashionship strategy, Cultural strategy.
This triangular scheme example was created using ConceptDraw DIAGRAM diagramming and vector drawing software extended with Pyramid Diagrams solution from Marketing area of ConceptDraw Solution Park.
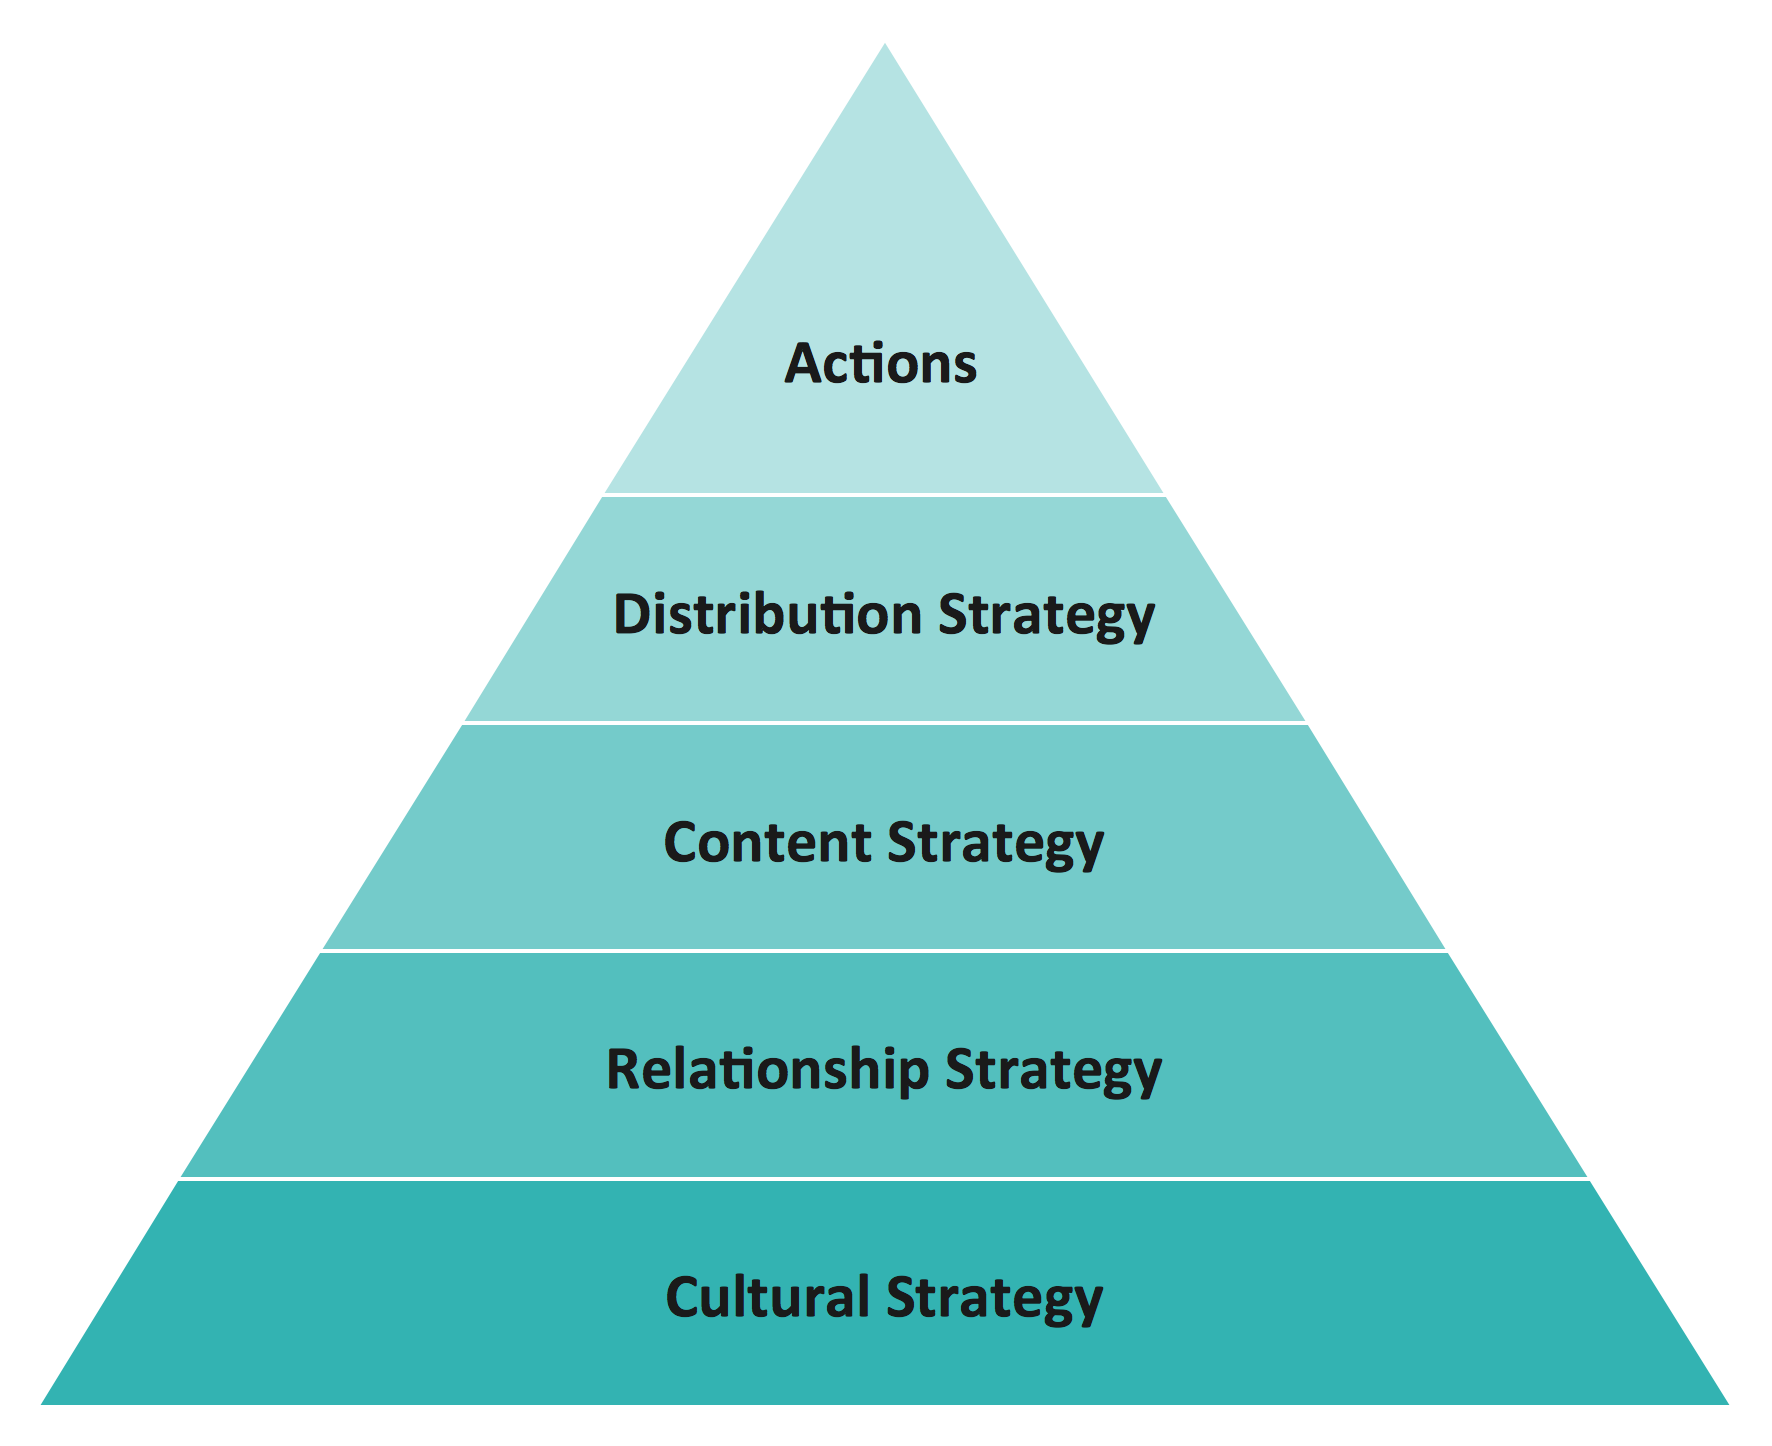
Example 3. Diagram Social strategy pyramid
Value pyramid - Marketing diagram
This market value pyramid diagram has 5 levels:
- Essence (Who we are),
- Competitive positioning (Where we play),
- Customer benefits (Value proposition),
- Product / Service features (Value delivery),
- Internal capabilitiea (Value requirements).
Use this triangular scheme to develop your marketing strategy. This triangle chart example was created using ConceptDraw DIAGRAM diagramming and vector drawing software extended with Pyramid Diagrams solution from Marketing area of ConceptDraw Solution Park.
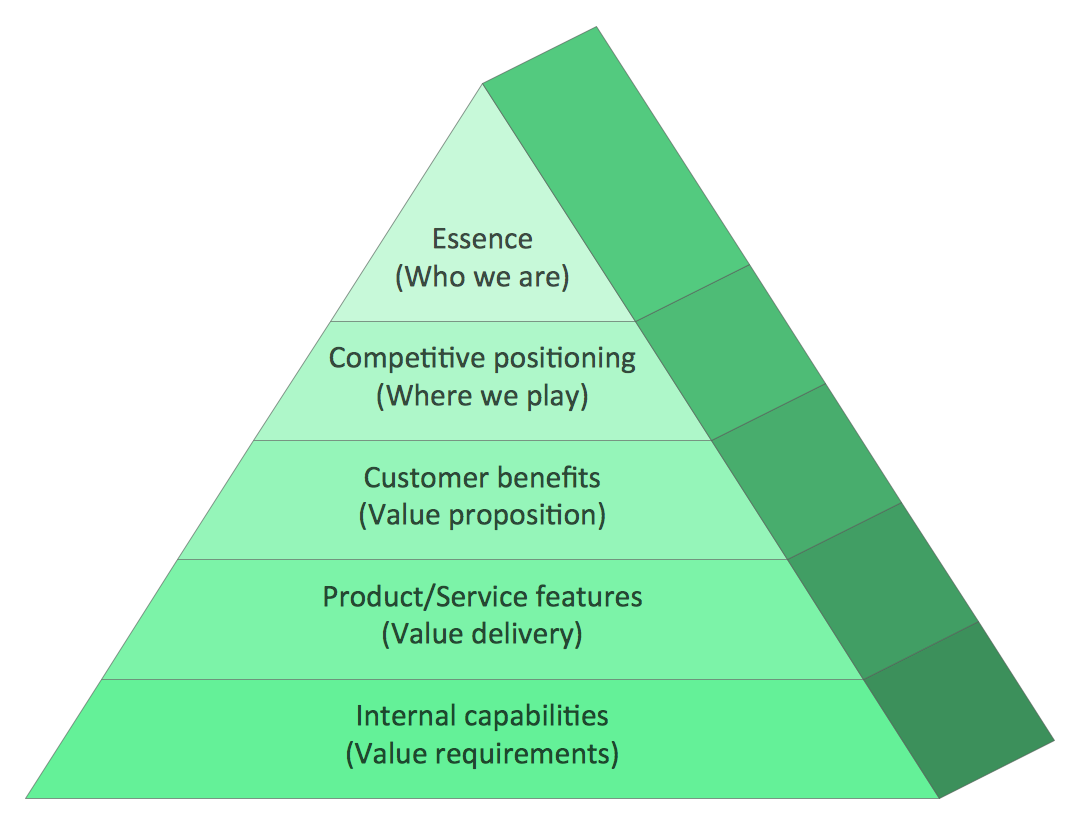
Example 4. Value pyramid - Marketing diagram
Cosystem goods and services
Ecosystems represent sources of natural capital and provide goods and services to society, also called ecosystem services. The Millennium Ecosystem Assessment identified over 24 ecosystem services that can be divided up into 4 general groups including:
- provisioning,
- supporting,
- regulating
- cultural.
This example is included in the Pyramid Diagrams solution from Marketing area of ConceptDraw Solution Park.

Example 5. Cosystem goods and services
See more Pyramid Diagram:
- Zooko Triangle Diagram
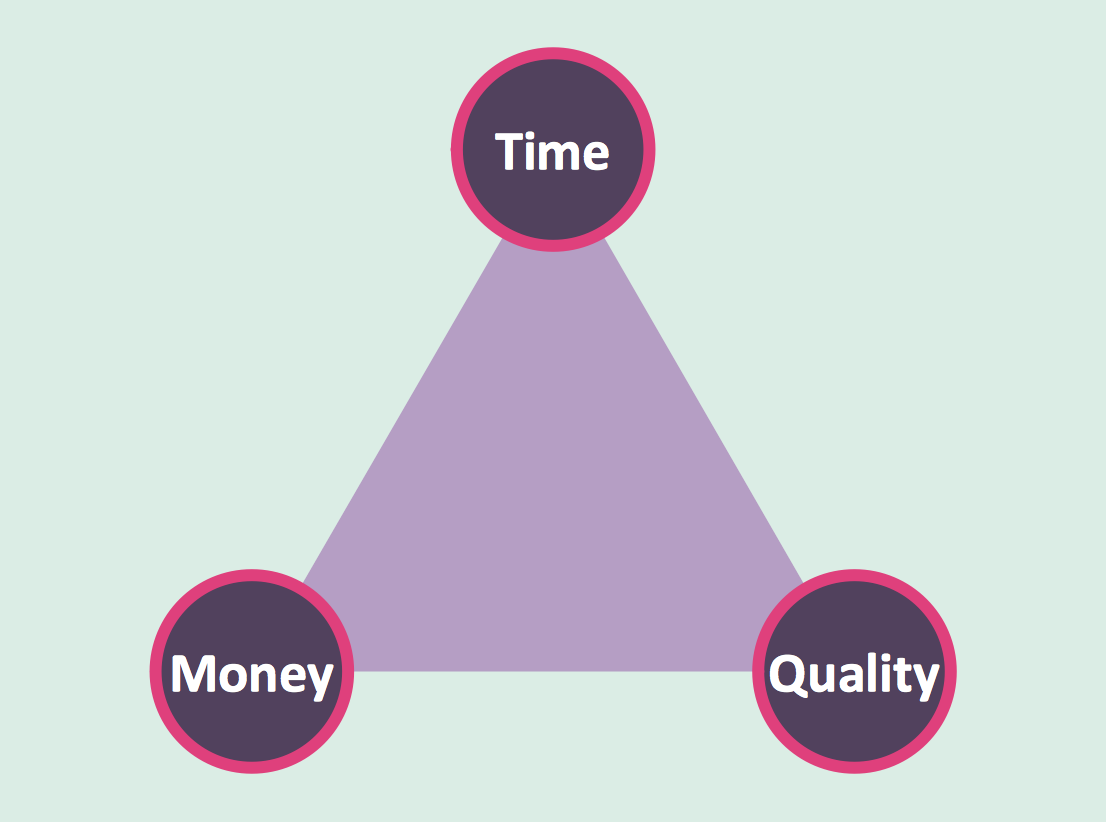
- Time, Quality, Money Triangle Diagram
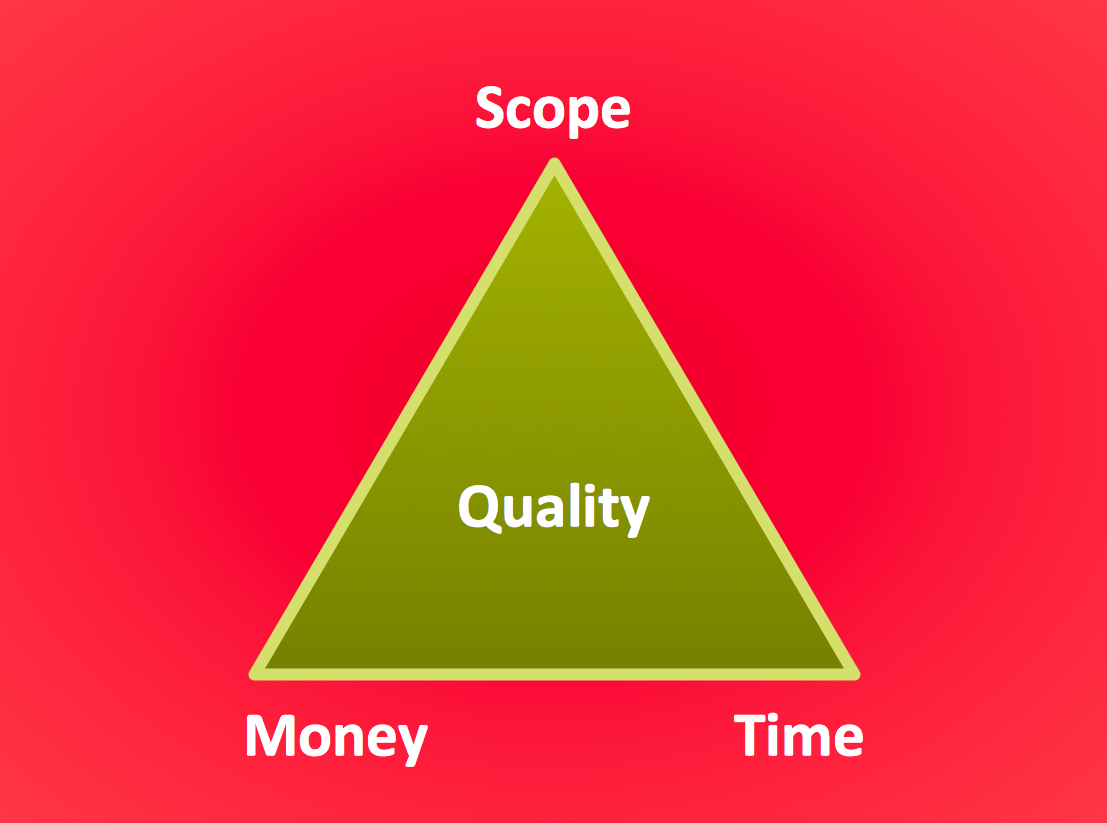
- Project Triangle Diagram
- Purchase Funnel Diagram
- Project Triangle Chart
- Priority Pyramid Diagram
- Organization Triangle Diagram
- Knowledge Triangle Diagram
- Triangular Graphic
- Inverted Pyramid
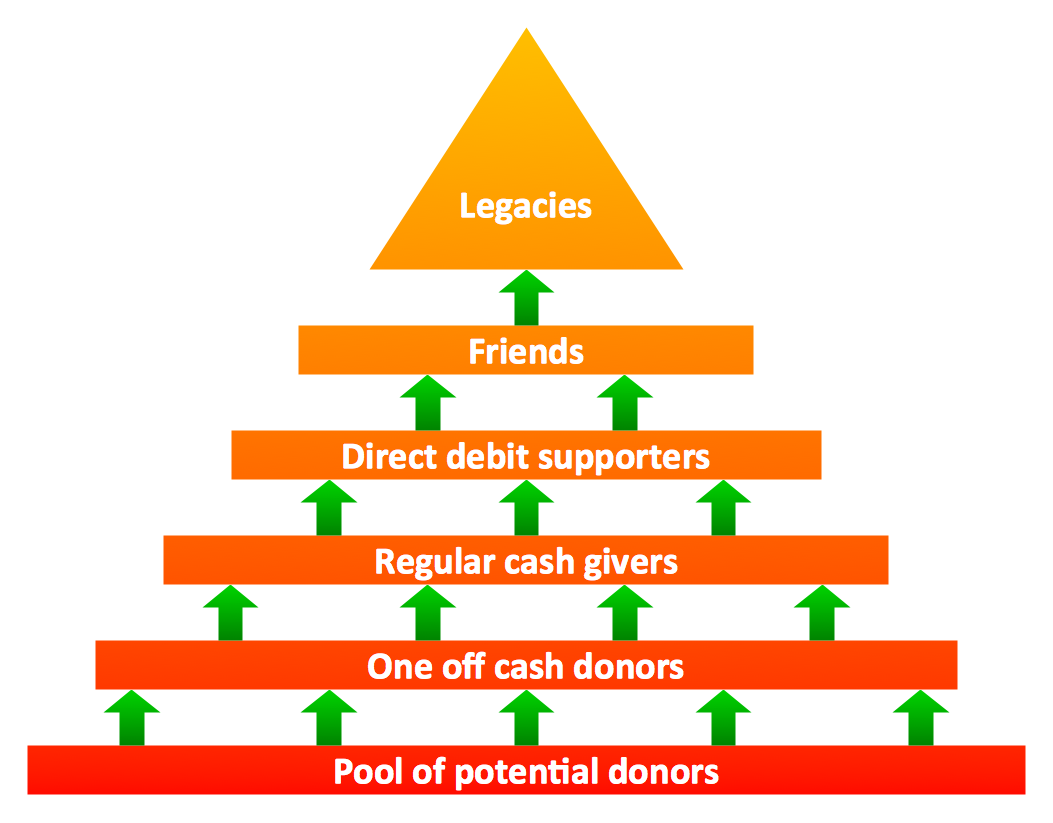
- Fundraising Pyramid
- 3D Triangle Diagram
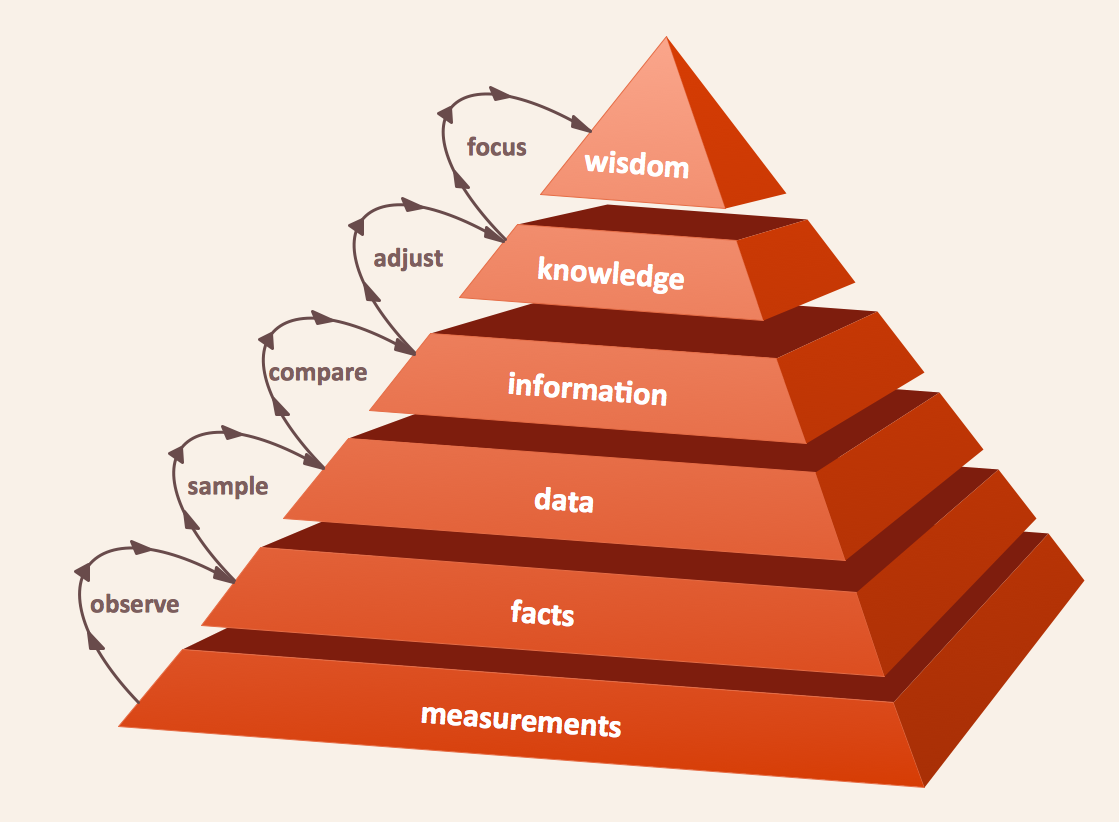
- DIKW Pyramid
- Five level pyramid model
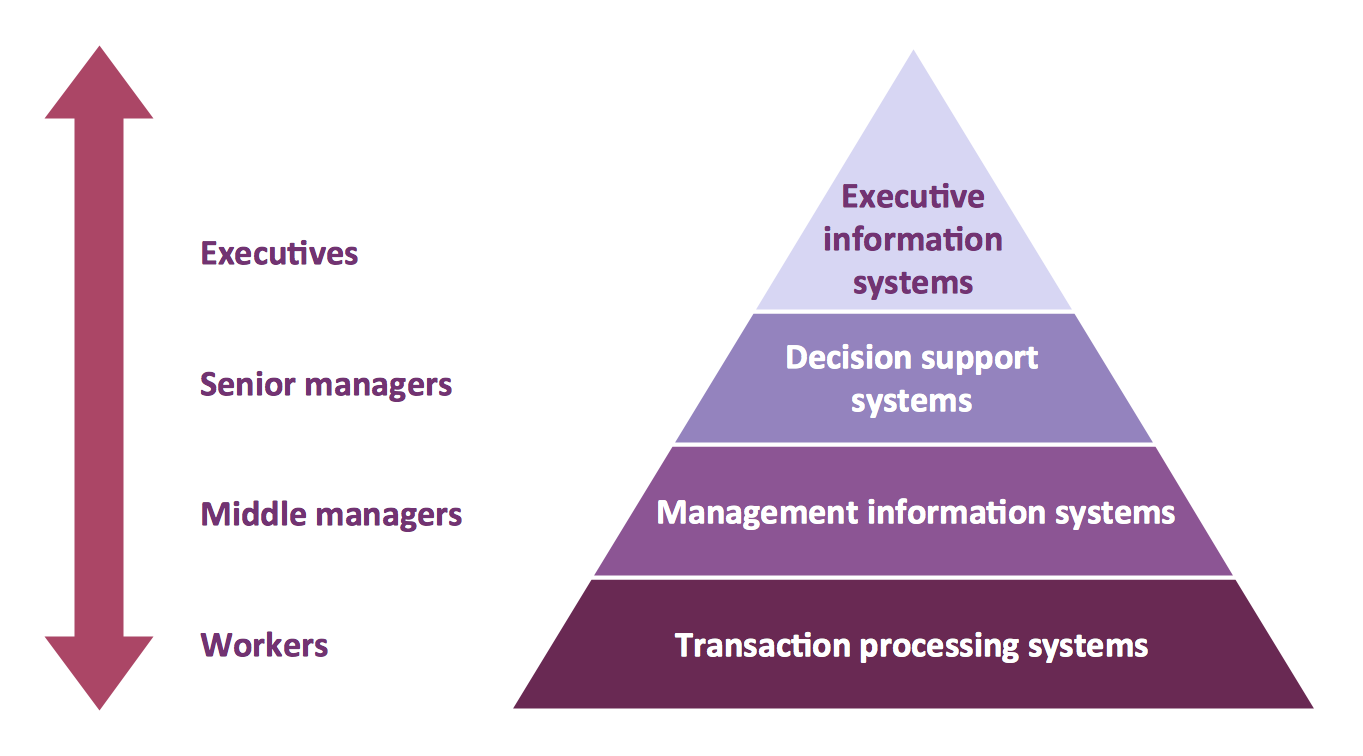
- Four level pyramid model
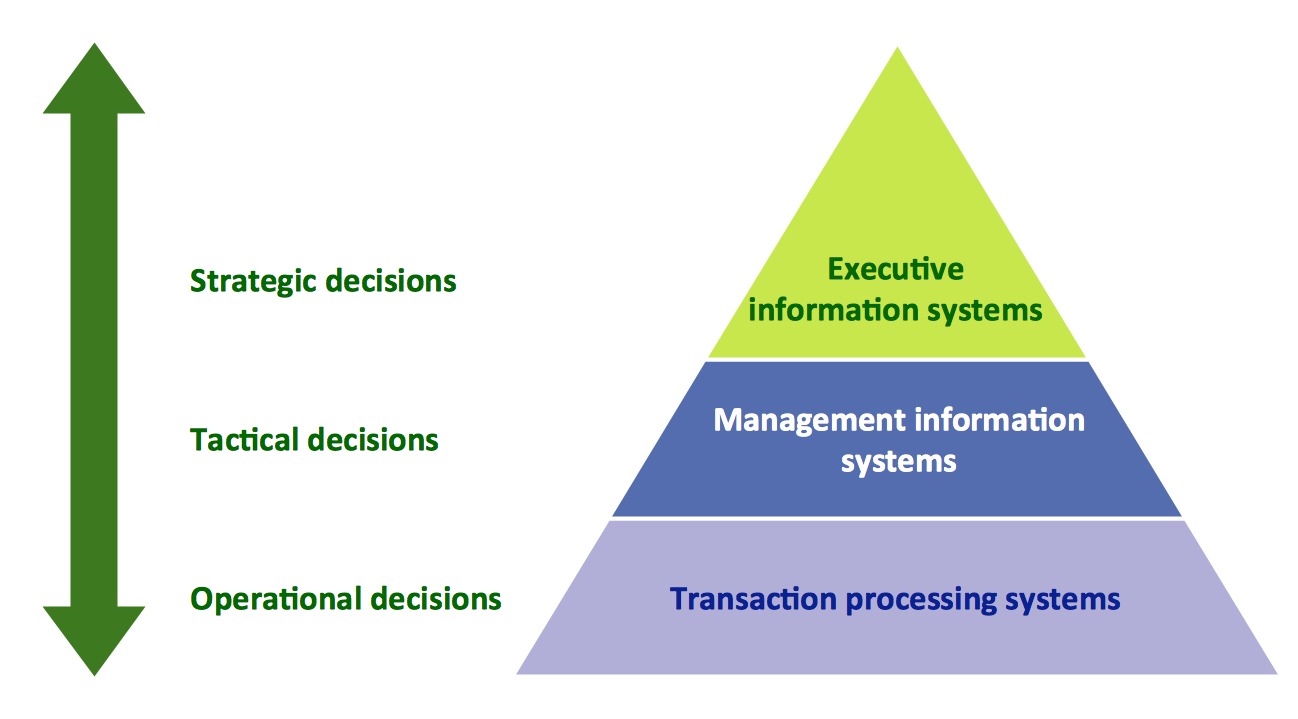
- Three level pyramid model