
Example 1. Pyramid Diagram. 5 level pyramid model of information systems types
This diagram was redesigned using ConceptDraw DIAGRAM diagramming and vector drawing software from Wikimedia Commons file. [commons.wikimedia.org]
This file is licensed under the Creative Commons Attribution 3.0 Unported license. [creativecommons.org]
This triangle chart example is included in the Pyramid Diagrams solution from Marketing area of ConceptDraw Solution Park.

Example 2. Pyramid Diagrams solution in ConceptDraw STORE
All source documents are vector graphic documents. They are available for reviewing, modifying, or converting to a variety of formats PDF file, MS PowerPoint, MS Visio, and many other graphic formats.
See more Pyramid Diagram:
TEN RELATED HOW TO's:
The most easier way of creating the visually engaging and informative Sales Process Flowchart is to create the new ConceptDraw document and to use the predesigned vector symbols offered in 6 libraries of the Sales Flowchart Solution. There are more than six types of sales process flow diagrams, ConceptDraw DIAGRAM software is flowchart maker which include six collections of extended flowchart symbols for effective diagramming. There are main collections of color coded flowchart symbols: Sales Department, Sales Steps, Sales Workflow, Sales Symbols and special set of Sales Arrows and Sales Flowchart.
Picture: Sales Process Flowchart Symbols
Related Solution:
The vector stencils library Yourdon and Coad Notation from the solution OOAD contains specific symbols of the Yourdon and Coad notation such as data store symbol, data process symbol, loop symbol for ConceptDraw DIAGRAM software.
Picture: Yourdon and Coad Diagram
ConceptDraw DIAGRAM diagramming and vector drawing software extended with Computer Network Diagrams Solution from the Computer and Networks Area offers a set of useful tools, collection of templates, samples, and libraries of various computer symbols, computer devices icons, computer network icon for fast and easy drawing network computer diagrams and illustrations.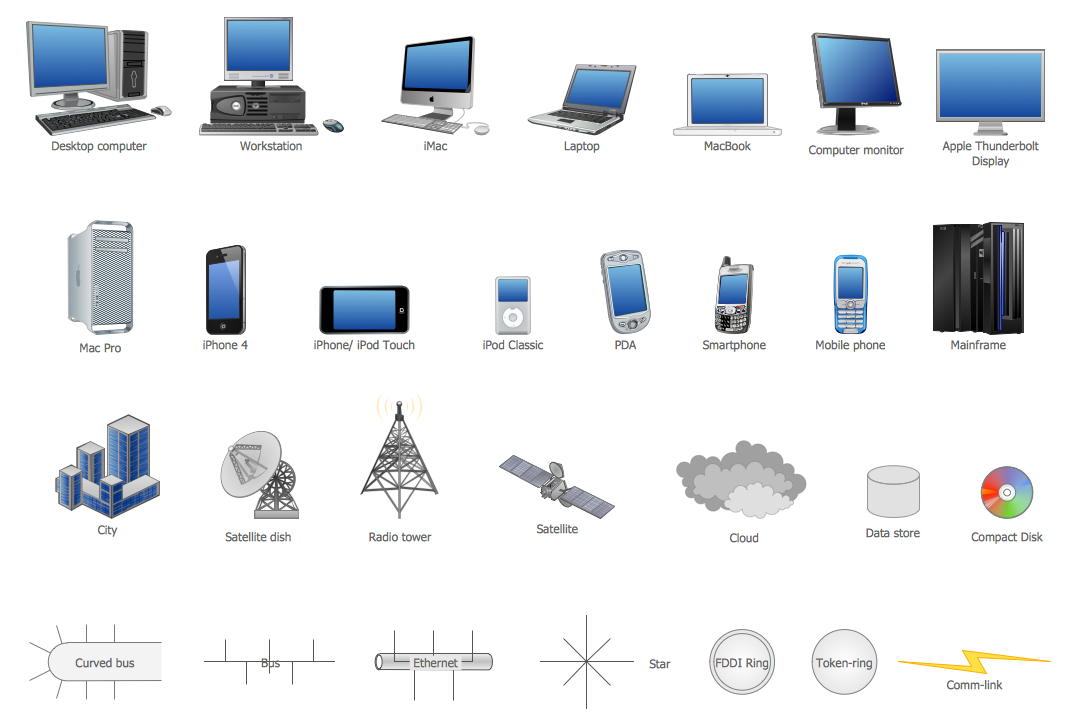
Picture: Network Icon
Related Solution:
An event-driven process chain diagram is a flowchart used in business process analysis. It evolved from Architecture of Integrated Information Systems (ARIS) and utilised in the business process improvement and analysis. It is also used to facilitate enterprise resource planning.
An EPC diagram is a complex flowchart that shows different business processes through various workflows. The workflows are seen as functions and events that are connected by different teams or people, as well as tasks that allow business processes to be executed.
ConceptDraw DIAGRAM is a software for making EPC diagrams that allows managers visually present business process models for making decisions for business.
Picture: How to Draw EPC Diagram Quickly
Related Solution:
ConceptDraw DIAGRAM is a powerful drawing tool that changes the way diagrams are produced.
Diagrama de Topologia or Topology Diagram helps you see the big picture as you develop a service.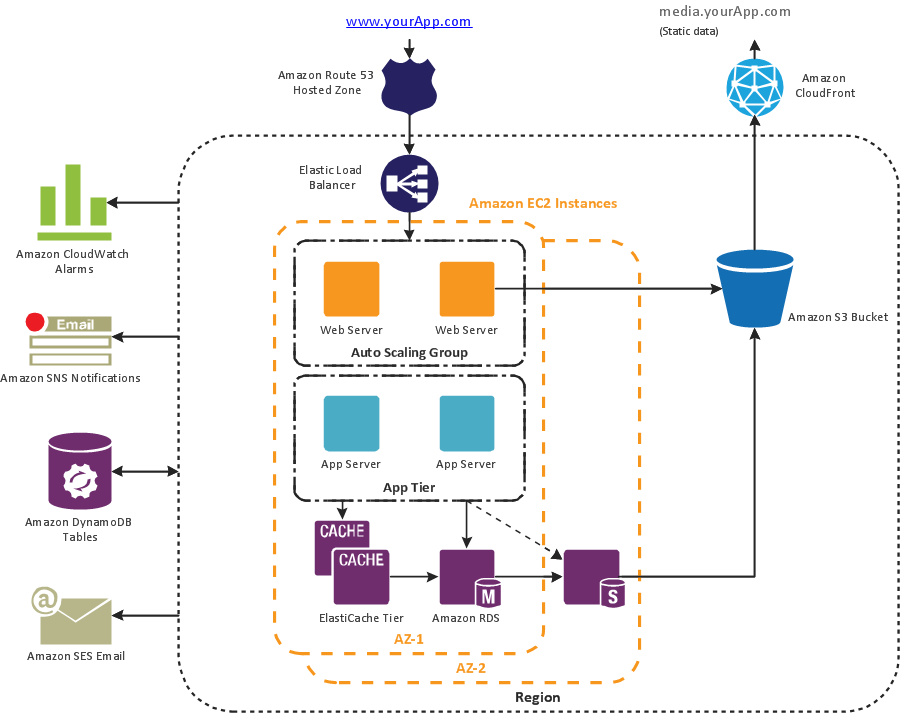
Picture: Diagrama de Topologia
Related Solution:
Complete set of bar chart examples is produced using ConceptDraw software. Surfing bar chart examples you can find an example that is the best for your case.
Picture: Bar Chart Examples
Related Solution:
You need to draw the Bar Graph? The automated tool can be useful for you. ConceptDraw DIAGRAM diagramming and vector drawing software extended with Bar Graphs solution from Graphs and Charts area of ConceptDraw Solution Park will help you create any Bar Graph.
Picture: Bar Graph
Related Solution:
ConceptDraw DIAGRAM is a powerful tool that helps you create a Cross Functional Flow Chart quickly and easily. Fine-tuning the objects in ConceptDraw DIAGRAM allows you to create a really professional finished article. ConceptDraw Arrows10 Technology gives drawing connectors a smart behavior that provides quick and precise placement, allows for easy changes and automatic rearrangement.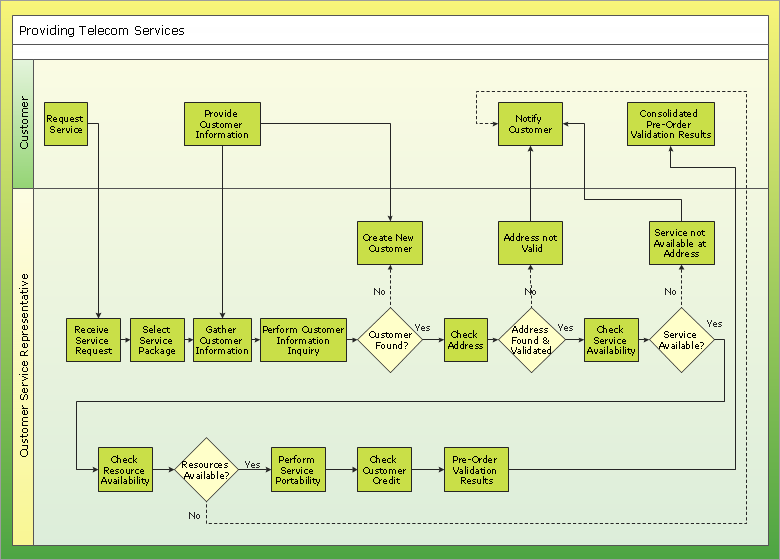
Picture: Double-headed Cross Functional Flowchart
Related Solution:
It's no secret that there is a list of skills that every average system administrator should have. And it's important to be able to manage domains via active directory technologies. The best way to keep all the details in mind is to draw a diagram representing users, groups and domains.
This diagram represents an Active Directory Services (Active Directory Domain Services). It can be helpful for system and network administrators to organize a network physical and logical elements (domains, data bases, servers, network equipment, end-user computers etc.) into a secure and logical structure. The logical structure of Active Directory is a hierarchical organization of all network components. The data that is stored in Active Directory comes from some diverse sources. The Active Directory diagram created using ConceptDraw Active Directory Diagram solution. It shows allocating group policies and functions assigned to end users. It helps to plan, manage and maintain the certain user access scenario.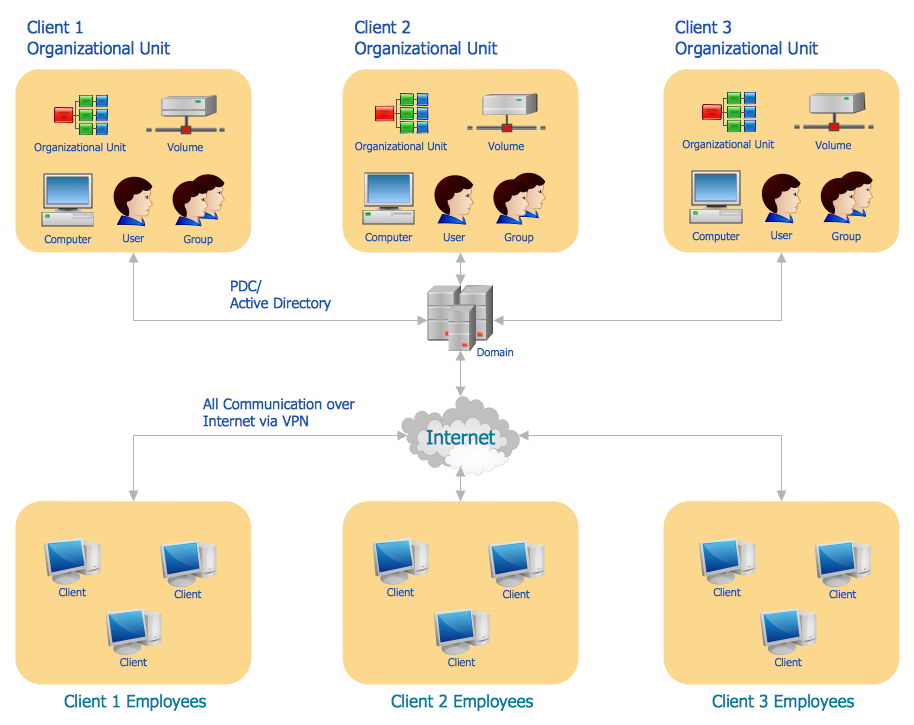
Picture: Active Directory Diagram
Related Solution:
A Data Flow Diagram (DFD) is a graphical technique which allows effectively model and analyze the information processes and systems. The ability to fast and easy create the DFDs is made possible with Data Flow Diagrams solution from the Software Development area of ConceptDraw Solution Park. For designing the Data Flow Diagrams are used simple DFD flowchart symbols which are connected each other by arrows depicting the data flow from one step to another.
Picture: DFD Flowchart Symbols
Related Solution:
