Sales Process Flowchart. Flowchart Examples

Sales Process Management

It is effective to use professional software for the sales process management. ConceptDraw DIAGRAM diagramming and vector drawing software extended with Sales Flowcharts solution from the Marketing area of ConceptDraw Solution Park is the best choice.
Sales Process Steps

Sales Process Flowcharts

Workflow Process Example

Sales Process Map

Sales Process

The Sales Process

Sales Process Flowchart Symbols

 Sales Flowcharts
The Sales Flowcharts solution lets you create and display sales process maps, sales process workflows, sales steps, the sales process, and anything else involving sales process management.
Marketing and Sales Organization chart. Organization chart Example

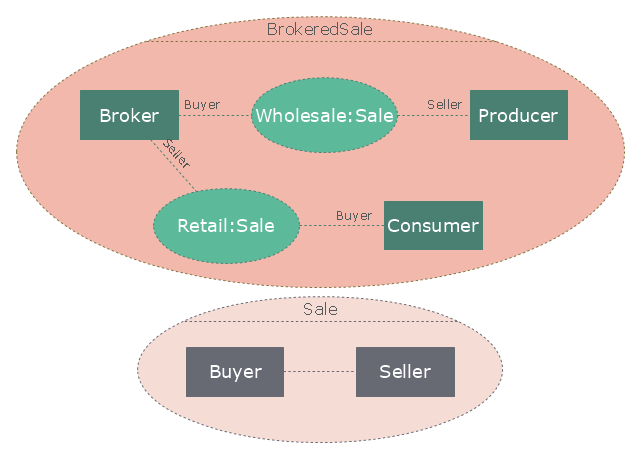
"A broker is an individual or party (brokerage firm) that arranges transactions between a buyer and a seller for a commission when the deal is executed. A broker who also acts as a seller or as a buyer becomes a principal party to the deal. Distinguish agent - one who acts on behalf of a principal. ...
In general a broker is an independent agent used extensively in some industries. A broker's prime responsibility is to bring sellers and buyers together and thus a broker is the third-person facilitator between a buyer and a seller. An example would be a real estate broker who facilitates the sale of a property.
Brokers also can furnish market information regarding prices, products, and market conditions. Brokers may represent either the seller (90% of the time) or the buyer (10%) but not both at the same time. An example would be a stockbroker, who makes the sale or purchase of securities on behalf of his client. Brokers play a huge role in the sale of stocks, bonds, and other financial services." [Broker. Wikipedia]
The UML composite structure diagram example "Sale process" was created using the ConceptDraw PRO diagramming and vector drawing software extended with the Rapid UML solution from the Software Development area of ConceptDraw Solution Park.
UML composite structure diagram
Venn Diagram Examples for Problem Solving

Approval Process and Segregation of Responsibilities Accounting Flowchart Example

Sales Steps

Pyramid Diagram

Business Process Optimization

Example Process Flow Chart

HR Flowchart Symbols

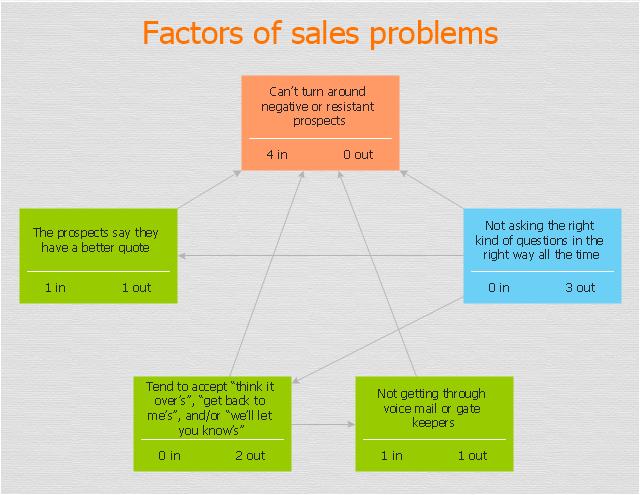
"The Interrelationship Digraph is used to determine, analyse and classify the cause and effect relationship that occurs between all of the important issues. This process is used when a group is unsure which of a group of issues has the greatest effect on all of the other issues." [decd.sa.gov.au/ speced2/ files/ links/ link_ 66898.pdf]
The relations diagram example "Sales process" was created using the ConceptDraw PRO diagramming and vector drawing software extended with the solution "Seven Management and Planning Tools" from the Management area of ConceptDraw Solution Park.
The relations diagram example "Sales process" was created using the ConceptDraw PRO diagramming and vector drawing software extended with the solution "Seven Management and Planning Tools" from the Management area of ConceptDraw Solution Park.
Relations diagram
- Sales Process Flowchart. Flowchart Examples | Introduction to ...
- Sales Process Flowchart. Flowchart Examples | Sales Process Map ...
- The Sales Process | Entity-Relationship Diagram (ERD) with ...
- Sales Process Flowchart. Flowchart Examples | Sales Process ...
- Point Of Sale Process Flow Diagram
- UML composite structure diagram - Sale process | Root cause ...
- Business Process Diagrams | Sales Process Flowchart. Flowchart ...
- Business Process Diagrams | Fishbone Diagram | Rapid UML ...
- Sales Strategy Diagram
- Sales Process Flowchart. Flowchart Examples | Structured Systems ...
- Dynamics Crm Sales Process Diagram
- Process Flowchart | Flow chart Example . Warehouse Flowchart ...
- Invoice lifecycle | Sales Flowcharts | Marketing Diagrams | How To ...
- Business - Workflow diagram | Sales Process Flowchart. Flowchart ...
- Logistics Flow Charts | Sales Process Flowchart Symbols | Sales ...
- Process Flowchart | Sales Process Flowchart. Flowchart Examples ...
- Business Process Diagrams | Application handling and invoicing ...
- Sales Process Flowchart Symbols | Work Order Process Flowchart ...
- Example of DFD for Online Store (Data Flow Diagram ) | Sales ...
- Draw A Point Of Sale System Process Diagram