Data Flow Diagram

Example of DFD for Online Store (Data Flow Diagram)


 Data Flow Diagrams (DFD)
Data Flow Diagrams solution extends ConceptDraw DIAGRAM software with templates, samples and libraries of vector stencils for drawing the data flow diagrams (DFD).
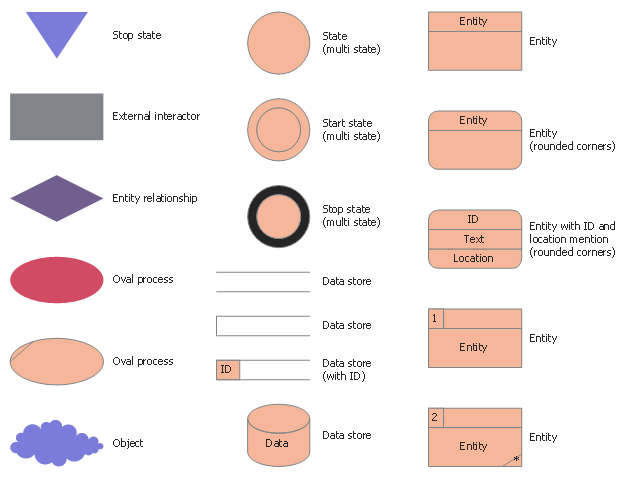
Data Flow Diagram Symbols. DFD Library

Data Flow Diagram Process

Data Flow Diagram Software

Data Flow Diagram (DFD)
 *")
Taxi Service Data Flow Diagram DFD Example

HelpDesk
How to Create a Data Flow Diagram

Data Flow Diagram Model

Structured Systems Analysis and Design Method. SSADM with ConceptDraw DIAGRAM

Accounting Data Flow from the Accounting Flowcharts Solution

DFD Library System

Gane Sarson Diagram

How to Create a Social Media DFD Flowchart

Design Data Flow. DFD Library

Garrett IA Diagrams with ConceptDraw DIAGRAM

The vector stencils library "Data flow diagram" contains 18 DFD notation symbols.
Use it to design your data flow diagrams with ConceptDraw PRO software.
The DFD symbols example "Design elements - Data flow diagram" is included in Сlassic Business Process Modeling solution from Business Processes area of ConceptDraw Solution Park.
Use it to design your data flow diagrams with ConceptDraw PRO software.
The DFD symbols example "Design elements - Data flow diagram" is included in Сlassic Business Process Modeling solution from Business Processes area of ConceptDraw Solution Park.
Vector stencils
The vector stencils library "Data flow diagram (DFD)" contains 15 DFD elements.
Use it for process-oriented models, data-oriented models, data flowcharts, data process diagrams, structured analysis diagrams, and information flow diagrams in the ConceptDraw PRO diagramming and vector drawing software extended with the Data Flow Diagrams solution from the Software Development area of ConceptDraw Solution Park.
Use it for process-oriented models, data-oriented models, data flowcharts, data process diagrams, structured analysis diagrams, and information flow diagrams in the ConceptDraw PRO diagramming and vector drawing software extended with the Data Flow Diagrams solution from the Software Development area of ConceptDraw Solution Park.
State (Multi State)
-data-flow-diagram-(dfd)---vector-stencils-library.png--diagram-flowchart-example.png)
State (Multi State)
-data-flow-diagram-(dfd)---vector-stencils-library.png--diagram-flowchart-example.png)
State (Multi State)
-data-flow-diagram-(dfd)---vector-stencils-library.png--diagram-flowchart-example.png)
Stop state 2
---vector-stencils-library.png--diagram-flowchart-example.png)
External Interactor
---vector-stencils-library.png--diagram-flowchart-example.png)
Entity Relationship
---vector-stencils-library.png--diagram-flowchart-example.png)
Oval process
---vector-stencils-library.png--diagram-flowchart-example.png)
Object
---vector-stencils-library.png--diagram-flowchart-example.png)
Entity
---vector-stencils-library.png--diagram-flowchart-example.png)
Entity (Rounded Corners)
-data-flow-diagram-(dfd)---vector-stencils-library.png--diagram-flowchart-example.png)
Entity with ID and Location Mention(Rounded Corners)
-data-flow-diagram-(dfd)---vector-stencils-library.png--diagram-flowchart-example.png)
Data store 1
---vector-stencils-library.png--diagram-flowchart-example.png)
Data store 2
---vector-stencils-library.png--diagram-flowchart-example.png)
Data store 3
---vector-stencils-library.png--diagram-flowchart-example.png)
Data store (with ID)
-data-flow-diagram-(dfd)---vector-stencils-library.png--diagram-flowchart-example.png)
Fruit Art

- Example of DFD for Online Store ( Data Flow Diagram ) | Basic ...
- Difference Between Data Flow Diagram And Architecture Diagram
- Data Flow Diagram Process | Why Flowchart Important to ...
- Data Flow Diagram Symbols. DFD Library | Example of DFD for ...
- Data Flow Diagram | Process Flowchart | Swim Lane Diagrams ...
- Basic Flowchart Symbols and Meaning | Data Flow Diagrams ...
- Data Flow Diagram For Financial Accounting System
- DFD Library System | Data Flow Diagram Symbols. DFD Library ...
- Example of DFD for Online Store ( Data Flow Diagram ) DFD ...
- DFD - Process of account receivable | Data structure diagram with ...
- Data Flow Diagram For Supermarket System
- Data Flow Diagram
- Enterprise Architecture Diagrams | Data Flow Diagrams (DFD) | Data ...
- Data Flow Diagram Level 0 1 2 For Library Management System
- Example of DFD for Online Store ( Data Flow Diagram ) | UML ...
- Data Flow Diagram For Electronic Shop Management System
- Data Flow Diagrams (DFD) | Dfd Diagram Of Online Library ...
- Data Flow Diagram With Scenario Examples
- Data structure diagram with ConceptDraw PRO | ConceptDraw PRO ...
- Data Flow Diagrams (DFD) | ConceptDraw PRO DFD Software ...