Social Media Response DFD Flowcharts - diagramming software ( Mac PC )
Diagramming software for Mac and PC - create flowcharts and presentations for Social Media Organizing.
Example of DFD for Online Store (Data Flow Diagram)
Data Flow Diagram (DFD) is a methodology of graphical structural analysis and information systems design, which describes the sources external in respect to the system, recipients of data, logical functions, data flows and data stores that are accessed. DFDs allow to identify relationships between various system's components and are effectively used in business analysis and information systems analysis. They are useful for system’s high-level details modeling, to show how the input data are transformed to output results via the sequence of functional transformations. For description of DFD diagrams are uses two notations — Yourdon and Gane-Sarson, which differ in syntax. Online Store DFD example illustrates the Data Flow Diagram for online store, the interactions between Customers, Visitors, Sellers, depicts User databases and the flows of Website Information. ConceptDraw DIAGRAM enhanced with Data Flow Diagrams solution lets you to draw clear and simple example of DFD for Online Store using special libraries of predesigned DFD symbols.
The Best Mac Software for Diagramming or Drawing
ConceptDraw DIAGRAM is a powerful intelligent vector graphics engine that can be used to create basic diagrams including flowcharts, charts, workflows, flowcharts, organizational charts, business diagram, learn business diagrams, flow diagrams.
ER Diagram Programs for Mac
ConceptDraw DIAGRAM compatible Mac OS X software extended with powerful Entity-Relationship Diagram (ERD) Solution from the Software Development Area for ConceptDraw Solution Park is one of the famous ER Diagram Programs for Mac. It gives the perfect ability to draw ER diagrams for visually describing databases with Chen's and Crow's Foot notation icons.Design Element: Crows Foot for Entity Relationship Diagram - ERD
Entity-Relationship Diagram (ERD) is ideal tool that helps execute the detalization of data warehouse for a given designed system, lets to document the system's entities, attributes (objects' properties), and their interactions each other (relationships). Creation of an ERD requires the choice of specific set of notations, which the best suits for your database design. Two notations - Chen’s and Crow's Foot are applied for ERDs design. Chen's notation was developed first and has linguistic approach, the boxes represent the entities and are considered as nouns, relationships between them are shown as diamonds in a verb form. Over time Chen’s style was adapted into the popular standard - Crow’s Foot notation, where entities are shown as boxes and relationships - as labeled lines. ConceptDraw DIAGRAM software supplied with Entity-Relationship Diagram (ERD) solution offers samples and templates of ER diagrams, and also ready-to-use vector design elements - ERD Crow′s Foot and Chen's notation icons for easy designing your own ER diagrams for depicting databases.In searching of alternative to MS Visio for MAC and PC with ConceptDraw DIAGRAM
Undoubtedly MS Visio is a powerful and multifunctional tool, but however at times occur the instances, when it turns unable of meeting certain users' requirements. At this cases you may need to use an alternative program software, preferably it will be simple, convenient, and at the same time powerful and professional. In searching the alternative to MS Visio for MAC and PC we recommend you to pay attention for ConceptDraw DIAGRAM software, which was developed to satisfy all your drawing needs and requirements. It is a fully-functioned alternative product to MS Visio for both platforms. ConceptDraw DIAGRAM software has many advantages, the main among them are the cross-platform compatibility, a reasonable price, widespread ConceptDraw Solution Park with huge variety of different solutions that offer numerous libraries of specialized vector objects, useful examples, samples, and quick-start templates, extensive import / export capabilities, built-in script language, MS Visio support and certainly free technical support.ConceptDraw DIAGRAM DFD Software
Our DFD software ConceptDraw DIAGRAM allows you to quickly create DFD with data storages, external entities, functional transforms, data flows, as well as control transforms and signals. DFD program ConceptDraw DIAGRAM has hundreds of templates, and a wide range of libraries with all nesassary ready-made drag-and-drop.Best Diagramming Software for macOS
ConceptDraw DIAGRAM creates drawings, flowcharts, block diagrams, bar charts, histograms, pie charts, divided bar diagrams, line graphs, area charts, scatter plots, circular arrows diagrams, Venn diagrams, bubble diagrams with great visual appeal on Mac OS X.
Selecting & Creating Flowcharts
ConceptDraw Flowcharts visualize a process or algorithm of program as step/operation blocks of various shapes connected with arrowed lines showed the process flow direction. They are used to visualize business or technical processes and software algorithms.Entity-Relationship Diagram (ERD) with ConceptDraw DIAGRAM
Entity-Relationship Diagram (ERD) is applied for detailed description of structures and high-level (conceptual) design databases using the Chen's and Crow's Foot notations. An ERD represents a diagram constructed mainly of rectangular blocks (for entities, data) linked with relationships. The links between the blocks are used to describe relations between the entities. There are three types of relationships: one-to-one, one-to-many, and many-to-many. Use the specialized ERD software - ConceptDraw DIAGRAM to create the Entity-Relationship Diagrams (ERDs) of any degree of complexity with Chen's and Crow's Foot notations. Draw them easily applying the powerful built-in tools and libraries of predesigned ERD vector objects from Entity-Relationship Diagram (ERD) solution from the Software Development area of ConceptDraw Solution Park. You can also start with one of ready template or sample included to this solution. Designing the ERDs in ConceptDraw DIAGRAM you can easy move the objects within a diagram with saving the relationships between them.
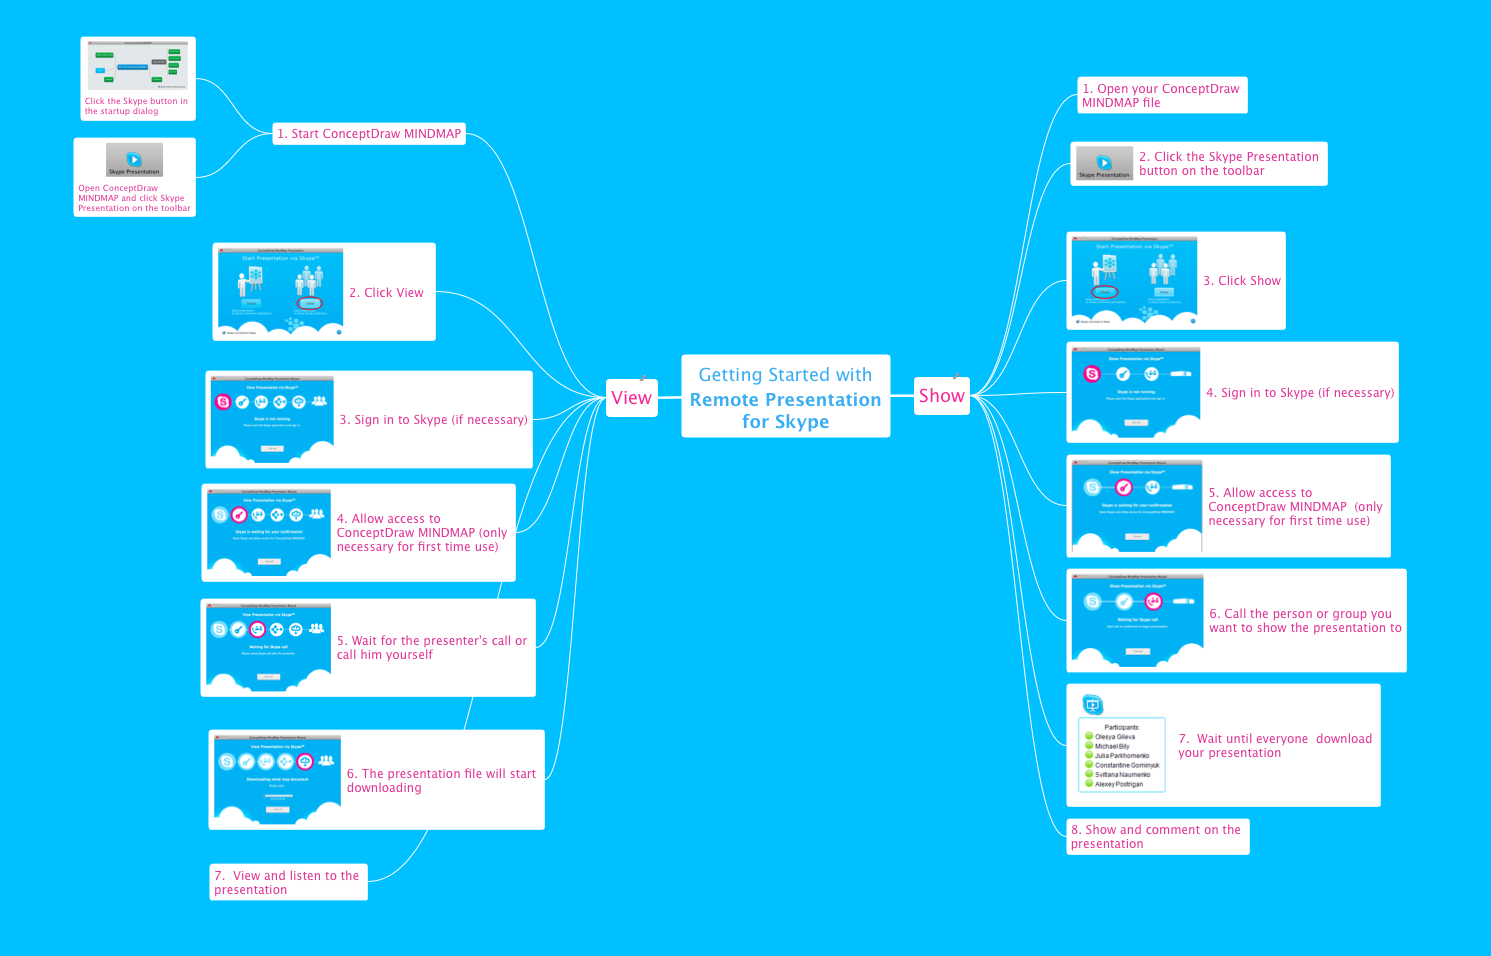
How To Collaborate via Skype
Online collaboration tool for workgroups that extends Skype conference call possibilities. This professional solution makes meetings more powerful and discussions more lively. Great way to engage your audience.
Data Flow Diagram Symbols. DFD Library
Data Flow Diagrams graphically represent the information transfers and process steps of a system. They visually depict how data are processed by a system in terms of inputs and outputs, how occurs the input in a system, how the data flow through an information system and where they are stored, and how occurs output from the system. DFDs give the overview of the system and models the processes aspects, they are maintained with other methods of structured systems analysis. The main goal of DFDs is achievement of understanding between developers and users. For their construction are used two notations - Gane-Sarson and Yourdon, each of them uses its own set of symbols. Data Flow Diagrams solution from Software Development area extends the ConceptDraw DIAGRAM software with templates, samples, and predesigned libraries of data flow diagram symbols for both notations, allowing you easy design the process-oriented and data-oriented models, draw the Data Flow Diagrams, Data Flowcharts, Data Process Diagrams, Information Flow Diagrams, Structured Analysis Diagrams, etc.Software and Database Design with ConceptDraw DIAGRAM
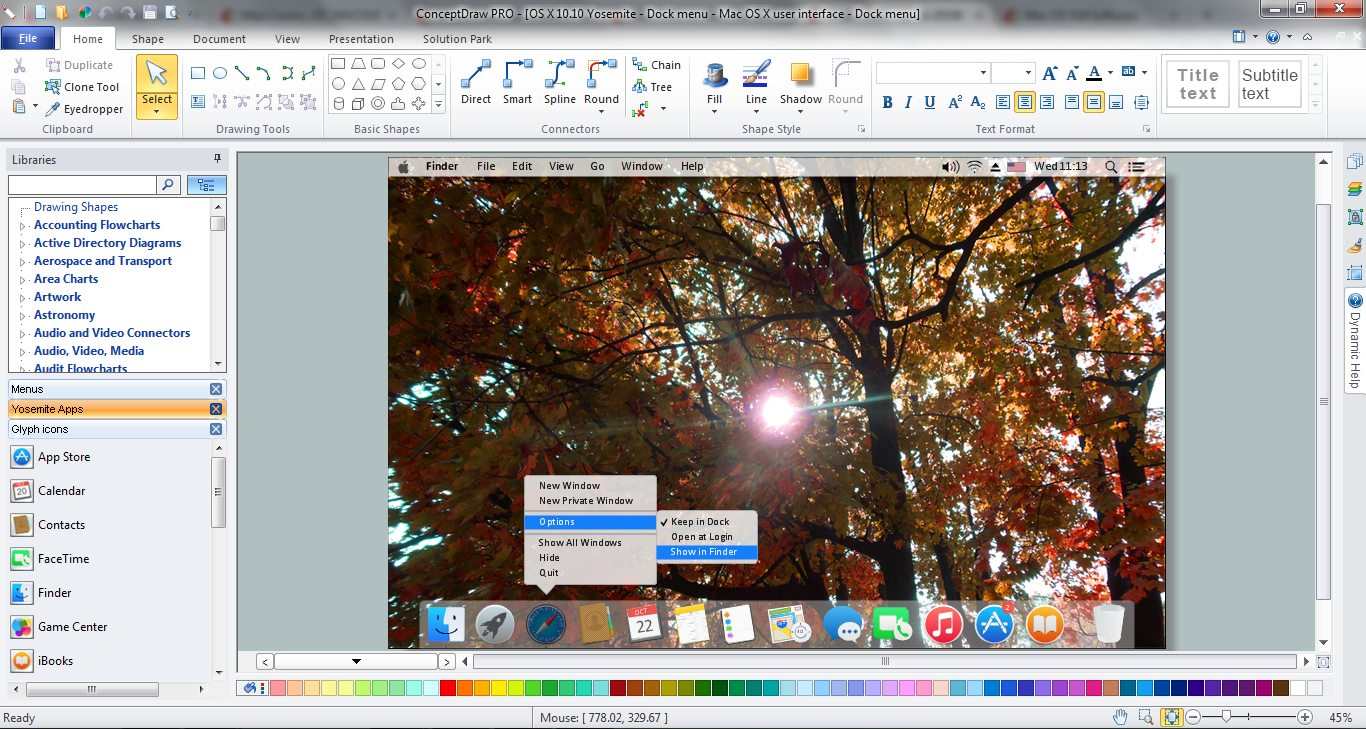
Unified Modeling Language (abbr. UML) is a modeling language used by software developers and software engineers for developing diagrams, expressive modeling, visualization, construction, specification, and documentation an information about software-intensive systems. There are used many types of UML diagrams, joined in main groups, each of them has its own functional abilities and applications: Behaviour diagrams illustrate the functionality of software systems, Structuring diagrams depict a structure of objects at the systems, Interaction diagrams show the flow of control and data among the things in a modeling system. UML has a lot of practical applications in varied areas, among them software development, hardware design, banking and financial services, telecommunication, science, research, enterprise information system, distributed Web-based services, user interfaces for web applications, medical electronics, patient healthcare systems, etc. ConceptDraw DIAGRAM extended with Rapid UML solution is a perfect tool for UML diagramming.Mac OS GUI Software
ConceptDraw DIAGRAM diagramming and vector drawing software extended with Mac OS User Interface Solution from the Software Development area is a powerful Mac OS GUI SoftwareDiagramming Software for Design UML Interaction Overview Diagrams
UML Interaction Overview Diagram schematically shows a control flow with nodes and a sequence of activities that can contain interaction or sequence diagrams.
Data Flow Diagrams
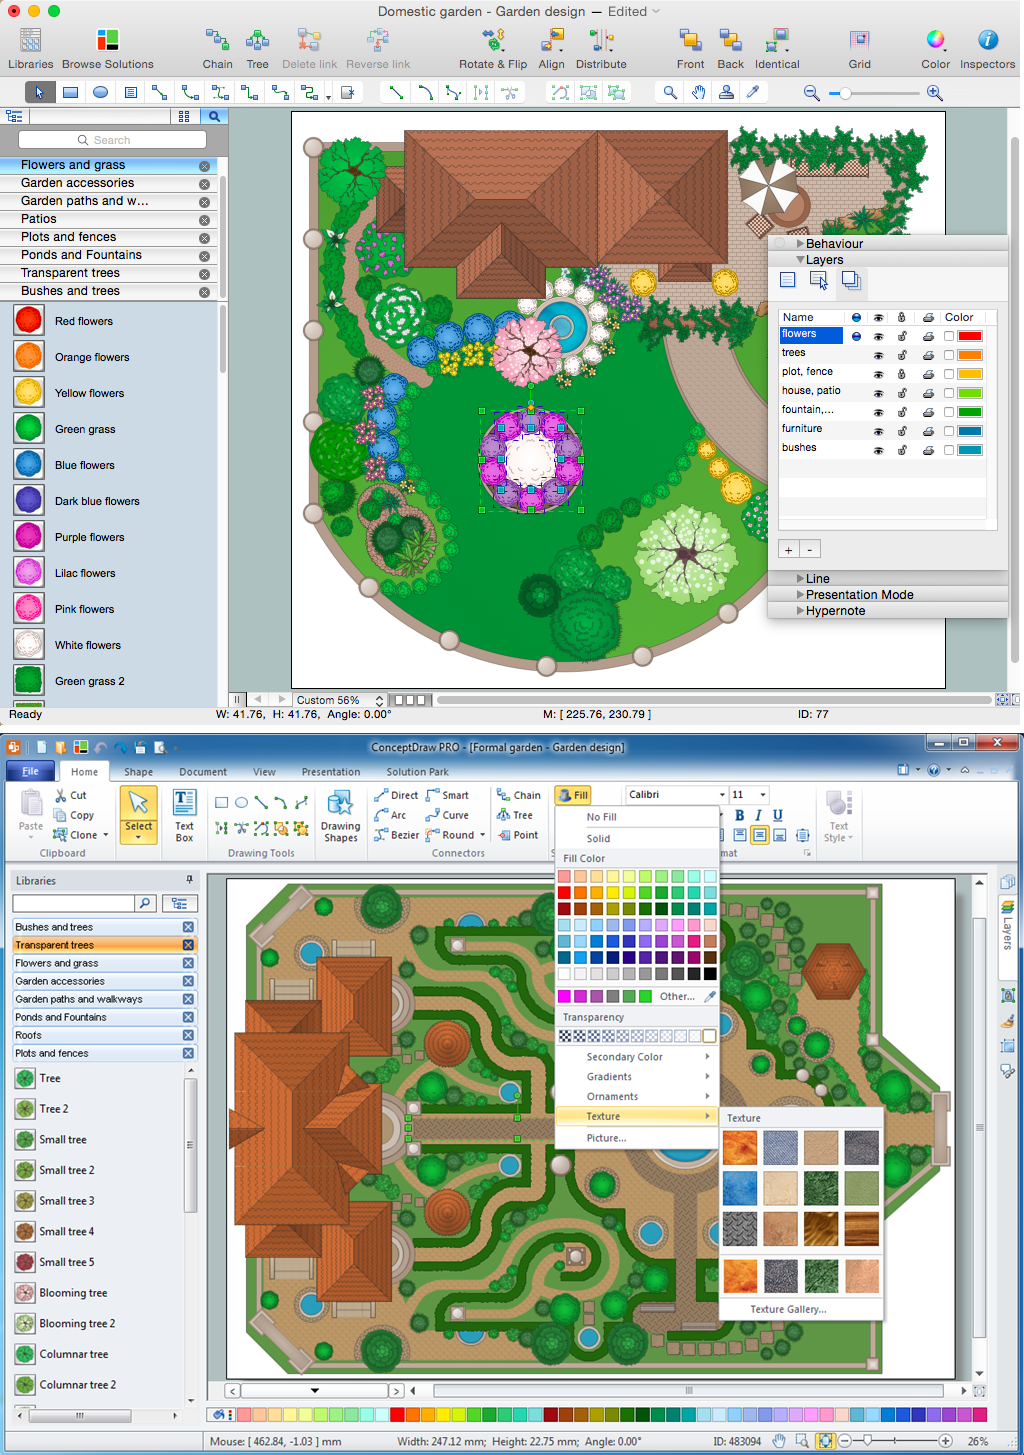
Data Flow Diagram (DFD) is a special chart type which lets graphically illustrate the "flow" of data through an information system. So the Data Flow Diagrams can be successfully used for visualization of data processing or structured design, for creation an overview of the system, for business process modeling, for exploring the high-level design in terms of data flows and documenting the major data flows. Inclusion of powerful Data Flow Diagrams solution to the Software Development area of ConceptDraw Solution Park makes the ConceptDraw DIAGRAM a beneficial data flow diagramming software and supplies it with numerous collection of quick-start templates, professionaly designed samples, and extensive range of ready-for-use vector objects consisting the Data Flow Diagrams, Gane-Sarson Notation, and Yourdon and Coad Notation libraries. Use the ConceptDraw DIAGRAM application to design easy and quickly the Data Flow Diagrams including the data storages, data flows, external entities, functional transforms, control transforms and signals.Landscape Architecture with ConceptDraw DIAGRAM
The landscape architecture includes landscape design, planning, and realization, as well as management of resources and buildings. The smaller scale landscape projects are well known as landscape design and garden design. The landscape design documentation is created independently from the project's scale and includes sketches, general plan and working documentation. On this stage the ConceptDraw DIAGRAM software extended with Landscape & Garden solution is irreplaceable assistant for you. The landscape designs created using ConceptDraw DIAGRAM are effectively used by landscape architects and engineers, also by landscape managers who maintain parks, gardens, natural landscapes like woodlands or nature reserves, and artificial landscapes. The Landscape and Garden solution contains 14 libraries with a lot of vector graphics objects of trees, flowers, bushes, fountains, ponds, furniture, roofs, patios, fences, garden accessories, entertainment, roads, junctions, etc., that are suitable for any gardener to simply design a wonderful garden.DFD Flowchart Symbols
A Data Flow Diagram (DFD) is a graphical technique which allows effectively model and analyze the information processes and systems. The ability to fast and easy create the DFDs is made possible with Data Flow Diagrams solution from the Software Development area of ConceptDraw Solution Park. For designing the Data Flow Diagrams are used simple DFD flowchart symbols which are connected each other by arrows depicting the data flow from one step to another.Process Flow app for macOS
Use ConceptDraw DIAGRAM diagramming and business graphics software to draw your own flowcharts of computer algorithms.Garrett IA Diagrams with ConceptDraw DIAGRAM
Garrett IA diagrams are used at development of Internet-resources, in particulars at projecting of interactions of web-resource elements. The diagram of information architecture of the web resource which is constructed correctly with necessary details presents to developers the resource in comprehensible and visual way.- How To Make Data Flow Diagram On Mac For Free
- ConceptDraw PRO DFD Software | Data Flow Diagram Maker For Mac
- Dfd Modeling Tool For Mac
- Basic Flowchart Symbols and Meaning | Data Flow Diagrams ...
- Mac Uml Tool Dfd
- Free Erd And Dfd Drawing Software For Mac
- Data Flow Diagrams (DFD) | Data Flow Model Diagram
- ConceptDraw PRO DFD Software | Free Dfd Tool
- Data Flow Diagram Drawing Tool Online
- Flow Chart Online | Example of DFD for Online Store ( Data Flow ...
- Top iPad Business Process Diagrams Apps | Business Process ...
- Data Flow Diagram In Os
- Data Flow Diagram | Process Flowchart | Swim Lane Diagrams ...
- Social Media Response DFD Flowcharts - diagramming software ...
- Entity Relationship Diagram Software for Mac | Drawing ER ...
- ConceptDraw PRO DFD Software | Dfd Software Download Free
- Draw Diagram on Mac | Diagramming Tool Mac | Mac Diagramming ...
- Data Flow Diagram
- Data structure diagram with ConceptDraw PRO | ConceptDraw PRO ...


