DFD Library System

DFD Library — Design elements

Data Flow Diagram Symbols. DFD Library

Design Data Flow. DFD Library

Data Flow Diagram Software

Data Flow Diagram (DFD)
 *")
DFD Flowchart Symbols

The vector stencils library "DFD, Yourdon and Coad notation" contains 22 DFD elements.
Use it for drawing data flow diagrams (DFD) using Yourdon/ DeMarco notation in the ConceptDraw PRO diagramming and vector drawing software extended with the Data Flow Diagrams solution from the Software Development area of ConceptDraw Solution Park.
Use it for drawing data flow diagrams (DFD) using Yourdon/ DeMarco notation in the ConceptDraw PRO diagramming and vector drawing software extended with the Data Flow Diagrams solution from the Software Development area of ConceptDraw Solution Park.
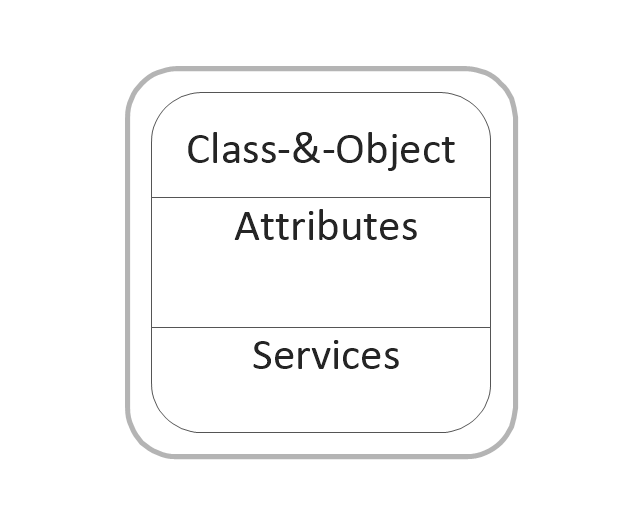
Class and object
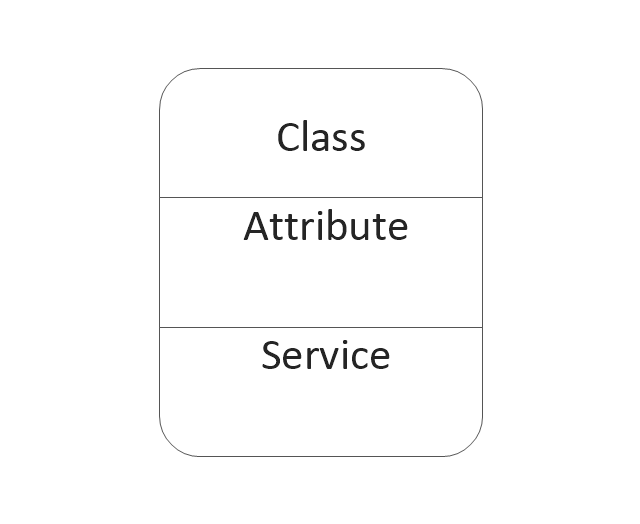
Class
Object state

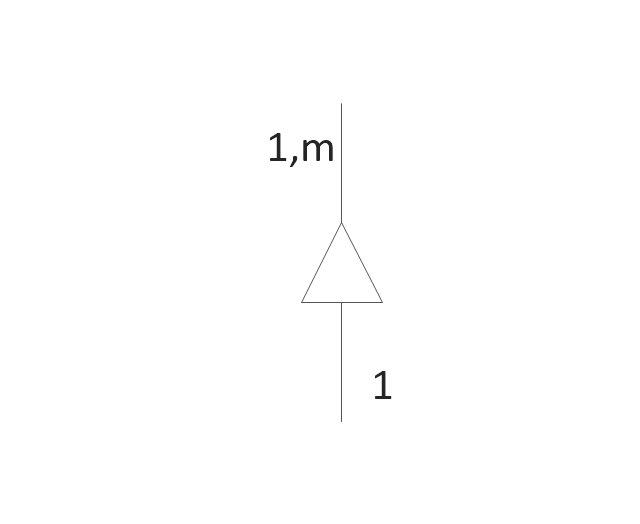
Generalization and specialization structure

Whole-part structure
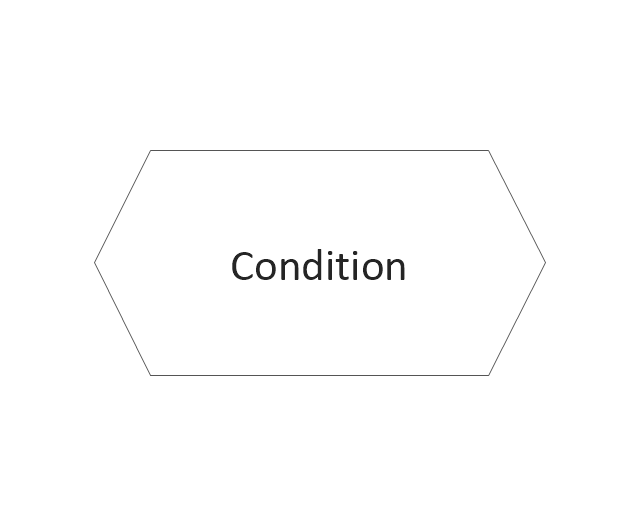
Condition
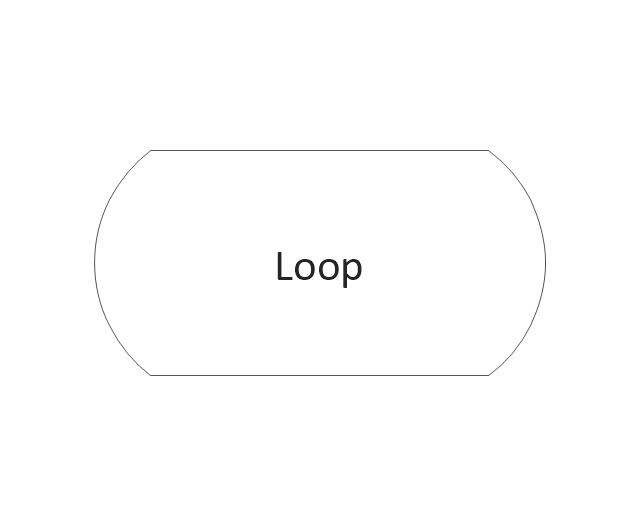
Loop
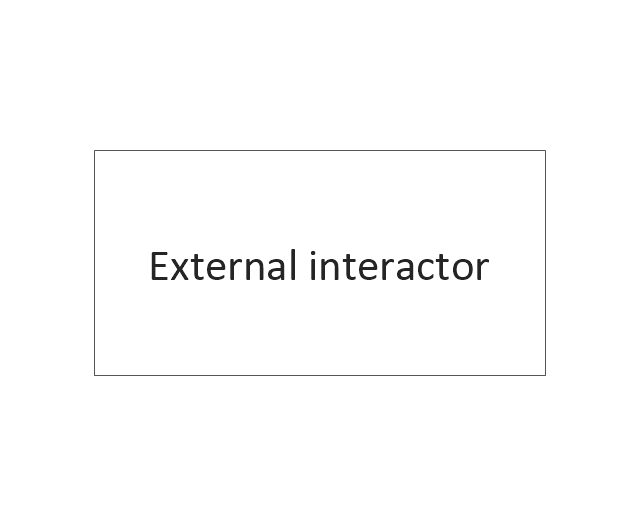
External interactor
Data process
Multiple process
State

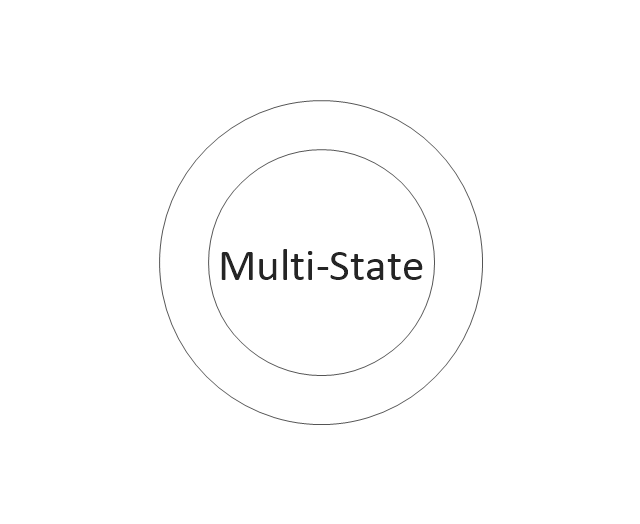
Multi-state
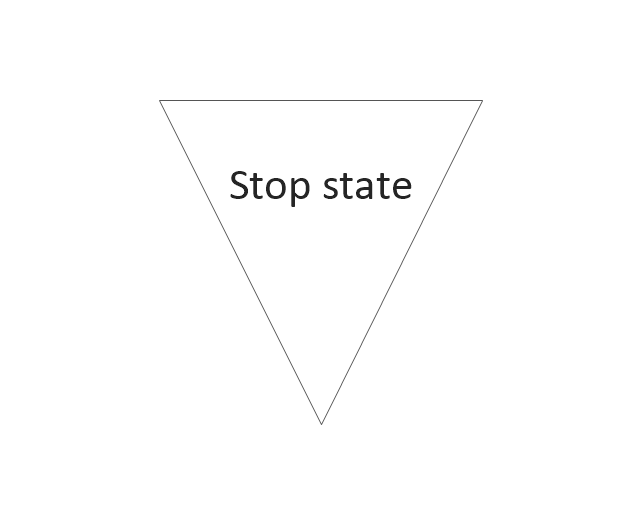
Stop state

Stop state2
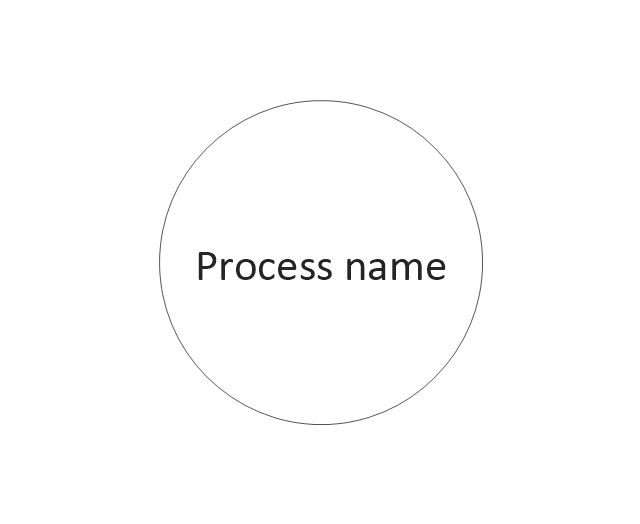
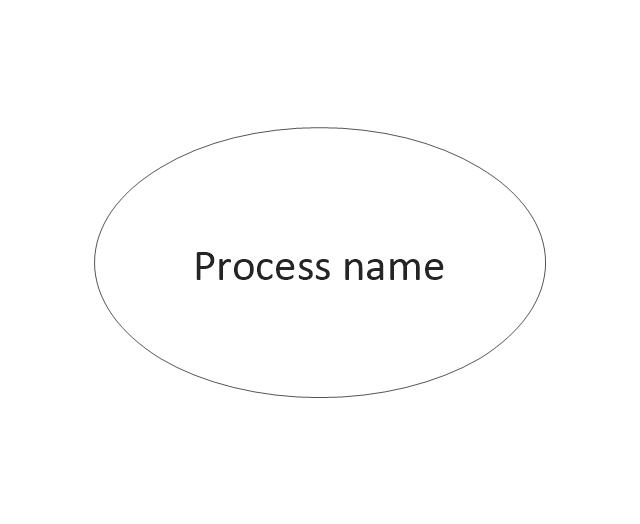
Process
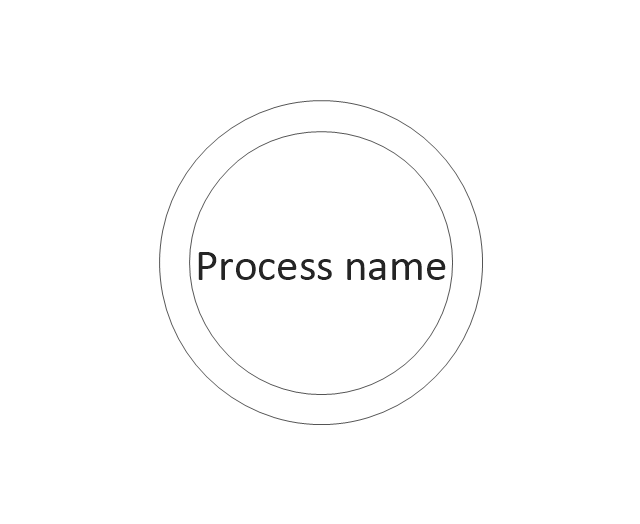
Process (offset)
-dfd,-yourdon-and-coad-notation---vector-stencils-library.png--diagram-flowchart-example.png)
Center to center

Center to center #2

Loop on center
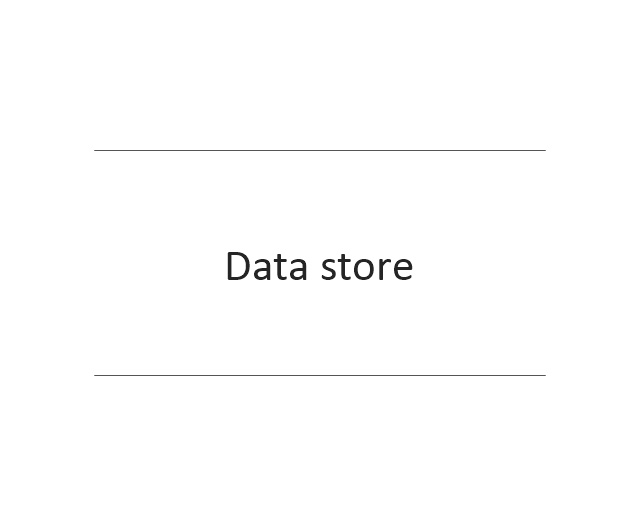
Data store
Instance

Message

Data Flow Diagram

The vector stencils library "DFD, Gane-Sarson notation" contains 12 DFD elements.
Use it for drawing data flow diagrams (DFD) using Gane-Sarson notation in the ConceptDraw PRO diagramming and vector drawing software extended with the Data Flow Diagrams solution from the Software Development area of ConceptDraw Solution Park.
Use it for drawing data flow diagrams (DFD) using Gane-Sarson notation in the ConceptDraw PRO diagramming and vector drawing software extended with the Data Flow Diagrams solution from the Software Development area of ConceptDraw Solution Park.
External Entity
Process
Process w / Location
Data Store
Jump
Angled Connector
Angled Connector 2
Top to Bottom Variable
Bottom to Side
Side to Side
Side to Same Side

Top to Top Side
Data Flow Diagrams

The vector stencils library "Data flow diagram (DFD)" contains 15 DFD elements.
Use it for process-oriented models, data-oriented models, data flowcharts, data process diagrams, structured analysis diagrams, and information flow diagrams in the ConceptDraw PRO diagramming and vector drawing software extended with the Data Flow Diagrams solution from the Software Development area of ConceptDraw Solution Park.
Use it for process-oriented models, data-oriented models, data flowcharts, data process diagrams, structured analysis diagrams, and information flow diagrams in the ConceptDraw PRO diagramming and vector drawing software extended with the Data Flow Diagrams solution from the Software Development area of ConceptDraw Solution Park.
State (Multi State)
-data-flow-diagram-(dfd)---vector-stencils-library.png--diagram-flowchart-example.png)
State (Multi State)
-data-flow-diagram-(dfd)---vector-stencils-library.png--diagram-flowchart-example.png)
State (Multi State)
-data-flow-diagram-(dfd)---vector-stencils-library.png--diagram-flowchart-example.png)
Stop state 2
---vector-stencils-library.png--diagram-flowchart-example.png)
External Interactor
---vector-stencils-library.png--diagram-flowchart-example.png)
Entity Relationship
---vector-stencils-library.png--diagram-flowchart-example.png)
Oval process
---vector-stencils-library.png--diagram-flowchart-example.png)
Object
---vector-stencils-library.png--diagram-flowchart-example.png)
Entity
---vector-stencils-library.png--diagram-flowchart-example.png)
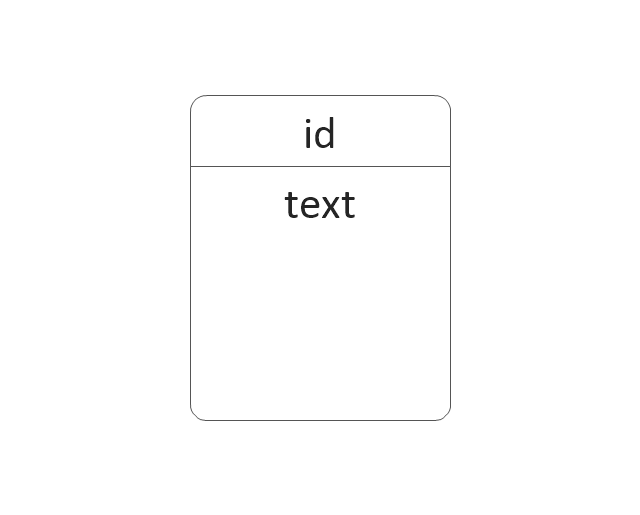
Entity (Rounded Corners)
-data-flow-diagram-(dfd)---vector-stencils-library.png--diagram-flowchart-example.png)
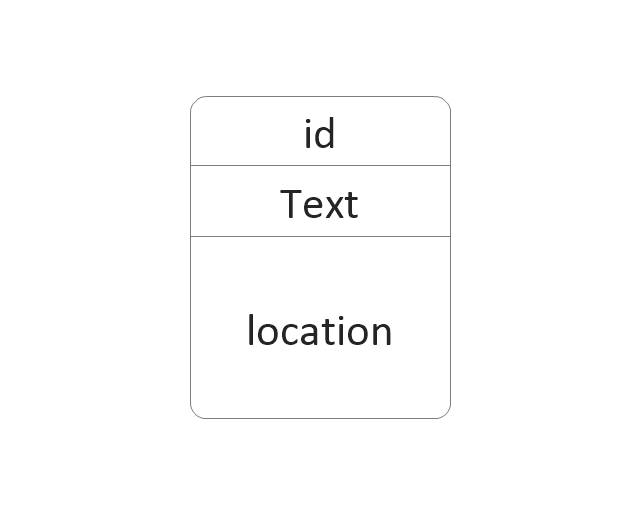
Entity with ID and Location Mention(Rounded Corners)
-data-flow-diagram-(dfd)---vector-stencils-library.png--diagram-flowchart-example.png)
Data store 1
---vector-stencils-library.png--diagram-flowchart-example.png)
Data store 2
---vector-stencils-library.png--diagram-flowchart-example.png)
Data store 3
---vector-stencils-library.png--diagram-flowchart-example.png)
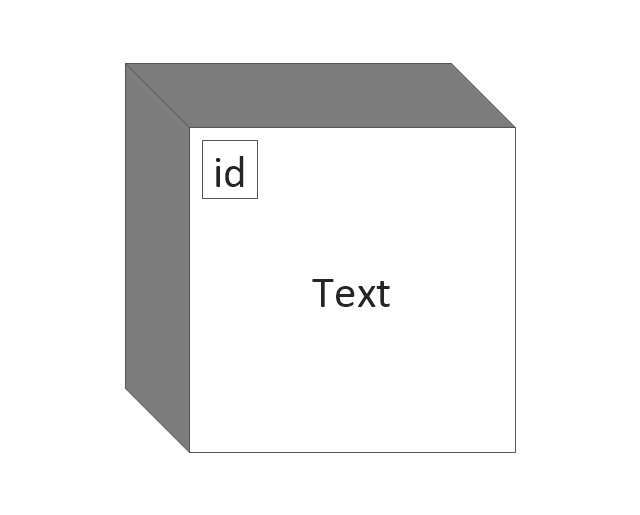
Data store (with ID)
-data-flow-diagram-(dfd)---vector-stencils-library.png--diagram-flowchart-example.png)
Business Process Flow Diagram

Example of DFD for Online Store (Data Flow Diagram)


IDEF0 Flowchart Symbols

How to Make Audio and Video Connections

How To Print Audio & Video Connectors Schema in a Large Format

Drawing a Nature Scene

Social Media Response DFD Flowcharts - diagramming software ( Mac PC )
 *")

UML Diagram Tool

- DFD Library System | Data Flow Diagram Symbols. DFD Library ...
- Data Flow Diagram Symbols. DFD Library | DFD Library System ...
- Data Flow Diagram Symbols. DFD Library | DFD Library System ...
- Data Flow Diagram Level 0 1 2 For Library Management System
- Data Flow Diagrams ( DFD ) | Dfd Diagram Of Online Library ...
- Data Flow Diagrams ( DFD ) | Logical Dfd For Library Management ...
- Data Flow Diagram Symbols. DFD Library
- Data Flow Diagram Symbols. DFD Library | Basic Flowchart ...
- Data Flow Diagram Symbols. DFD Library | Example of DFD for ...
- Data Flow Diagrams ( DFD ) | Dfd For Library Automation System
- Data Flow Diagrams ( DFD ) | Dfd Library Management System All ...
- Data Flow Diagrams ( DFD ) | All Levels Dfd Library Management ...
- Data Flow Diagram Symbols. DFD Library | DFD Library System ...
- Dfd And Er Daigram Of Library Management System Project
- Data Flow Diagram Symbols. DFD Library | Data Flow Diagram ...
- Data Flow Diagram For Manual Library Acquisition System
- DFD Library System | Database Flowchart Symbols | Data Flow ...
- Context Diagram Template | DFD Library System | Example of DFD ...
- DFD Library System | Data Flow Diagram Symbols. DFD Library ...
- Data Flow Diagram Symbols. DFD Library | ConceptDraw DIAGRAM ...