Use this template to create your DFD by Yourdon and Coad notation using the ConceptDraw PRO diagramming and vector drawing software extended with the Data Flow Diagrams solution from the Software Development area of ConceptDraw Solution Park.
DFD template
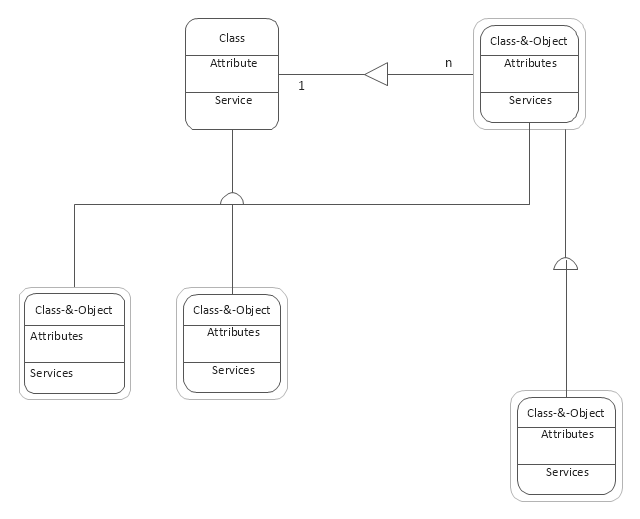
The vector stencils library "DFD, Yourdon and Coad notation" contains 22 DFD elements.
Use it for drawing data flow diagrams (DFD) using Yourdon/ DeMarco notation in the ConceptDraw PRO diagramming and vector drawing software extended with the Data Flow Diagrams solution from the Software Development area of ConceptDraw Solution Park.
Use it for drawing data flow diagrams (DFD) using Yourdon/ DeMarco notation in the ConceptDraw PRO diagramming and vector drawing software extended with the Data Flow Diagrams solution from the Software Development area of ConceptDraw Solution Park.
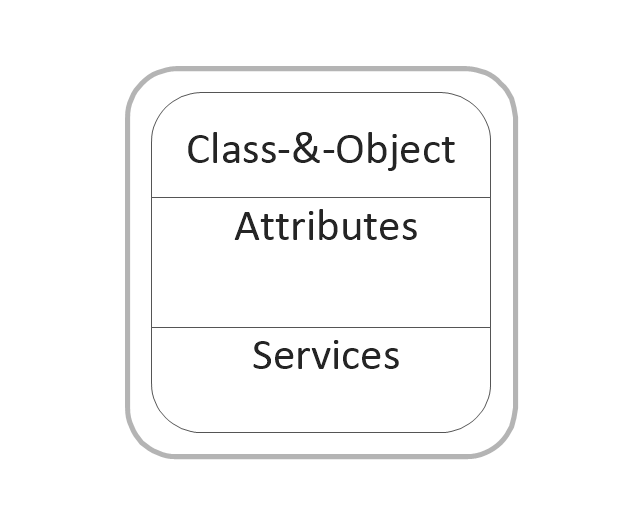
Class and object
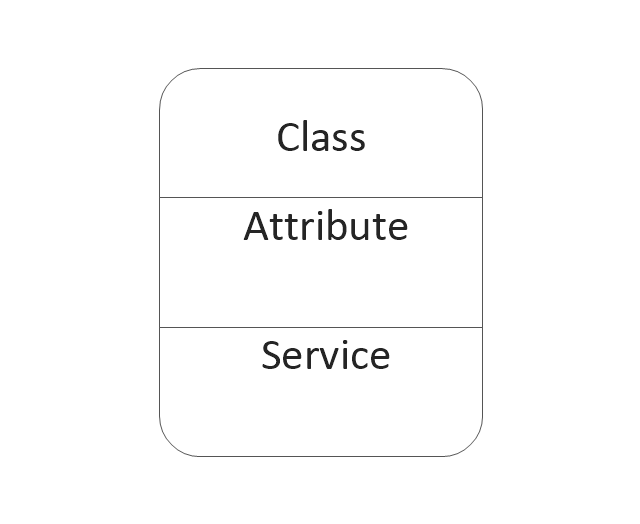
Class
Object state

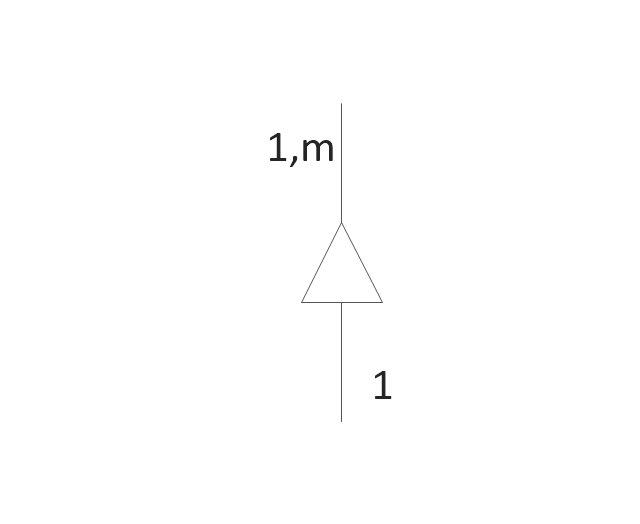
Generalization and specialization structure

Whole-part structure
Condition
Loop
External interactor
Data process
Multiple process
State
Multi-state
Stop state

Stop state2
Process
Process (offset)
-dfd,-yourdon-and-coad-notation---vector-stencils-library.png--diagram-flowchart-example.png)
Center to center

Center to center #2

Loop on center
Data store
Instance

Message

Data Flow Diagram Symbols. DFD Library

DFD Flowchart Symbols

 Data Flow Diagrams (DFD)
Data Flow Diagrams solution extends ConceptDraw DIAGRAM software with templates, samples and libraries of vector stencils for drawing the data flow diagrams (DFD).
Data Flow Diagram

"Data flow diagrams are one of the three essential perspectives of the structured-systems analysis and design method SSADM. The sponsor of a project and the end users will need to be briefed and consulted throughout all stages of a system's evolution. With a data flow diagram, users are able to visualize how the system will operate, what the system will accomplish, and how the system will be implemented. The old system's dataflow diagrams can be drawn up and compared with the new system's data flow diagrams to draw comparisons to implement a more efficient system. Data flow diagrams can be used to provide the end user with a physical idea of where the data they input ultimately has an effect upon the structure of the whole system from order to dispatch to report. How any system is developed can be determined through a data flow diagram model.
In the course of developing a set of levelled data flow diagrams the analyst/ designers is forced to address how the system may be decomposed into component sub-systems, and to identify the transaction data in the data model.
Data flow diagrams can be used in both Analysis and Design phase of the SDLC.
There are different notations to draw data flow diagrams (Yourdon & Coad and Gane & Sarson), defining different visual representations for processes, data stores, data flow, and external entities." [Data flow diagram. Wikipedia]
The DFD (Yourdon and Coad notation) example "Process of account receivable" was created using the ConceptDraw PRO diagramming and vector drawing software extended with the Data Flow Diagrams solution from the Software Development area of ConceptDraw Solution Park.
Data Flow Diagram

DFD Library — Design elements

Data Flow Diagram (DFD)
 *")
Data Flow Diagrams

Design Data Flow. DFD Library

Data Flow Diagram Examples

Example of DFD for Online Store (Data Flow Diagram)


Database Flowchart Symbols

"A data flow diagram (DFD) is a graphical representation of the "flow" of data through an information system. It differs from the flowchart as it shows the data flow instead of the control flow of the program. A data flow diagram can also be used for the visualization of data processing (structured design). Data flow diagrams were invented by Larry Constantine, the original developer of structured design, based on Martin and Estrin's "data flow graph" model of computation.
It is common practice to draw a context-level Data flow diagram first which shows the interaction between the system and outside entities. The DFD is designed to show how a system is divided into smaller portions and to highlight the flow of data between those parts. This context-level Data flow diagram is then "exploded" to show more detail of the system being modeled" [Data model. Wikipedia]
The DFD (Yourdon and Coad notation) example "Model of small traditional production enterprise" was created using the ConceptDraw PRO diagramming and vector drawing software extended with the Data Flow Diagrams solution from the Software Development area of ConceptDraw Solution Park.
Data Flow Diagram Model

Data Flow Diagram Example

ConceptDraw DIAGRAM DFD Software

Data Flow Diagram Software

Data Flow Diagrams

Property Management Examples

- Yourdon and Coad Diagram | DFD , Yourdon and Coad notation ...
- Yourdon and Coad Diagram | DFD , Yourdon and Coad notation ...
- DFD , Yourdon and Coad notation - Vector stencils library | DFD ...
- DFD , Yourdon and Coad notation - Vector stencils library | Data ...
- DFD , Yourdon and Coad notation - Vector stencils library ...
- Data flow diagram - Template | DFD , Yourdon and Coad notation ...
- Difference Between Data Flow Diagram And Architecture Diagram
- Yourdon and Coad Diagram | ConceptDraw DIAGRAM DFD ...
- Coad / Yourdon's Object-Oriented Analysis model | ConceptDraw ...
- DFD , Yourdon and Coad notation - Template | DFD , Gane-Sarson ...
- Yourdon and Coad Diagram | Data Flow Diagram Symbols . DFD ...
- DFD , Yourdon and Coad notation - Vector stencils library | Coad ...
- DFD , Yourdon and Coad notation - Vector stencils library
- Gane Sarson Diagram | DFD , Gane-Sarson notation - Template ...
- Data Flow Diagram Vs Class
- Data Flow Diagram Symbols . DFD Library | Data Flow Diagram ...
- Basic Flowchart Symbols and Meaning | Data Flow Diagrams ...
- DFD Library System | Data Flow Diagram Symbols . DFD Library ...
- Enterprise Architecture Diagrams | Data Flow Diagrams ( DFD ) | Data ...