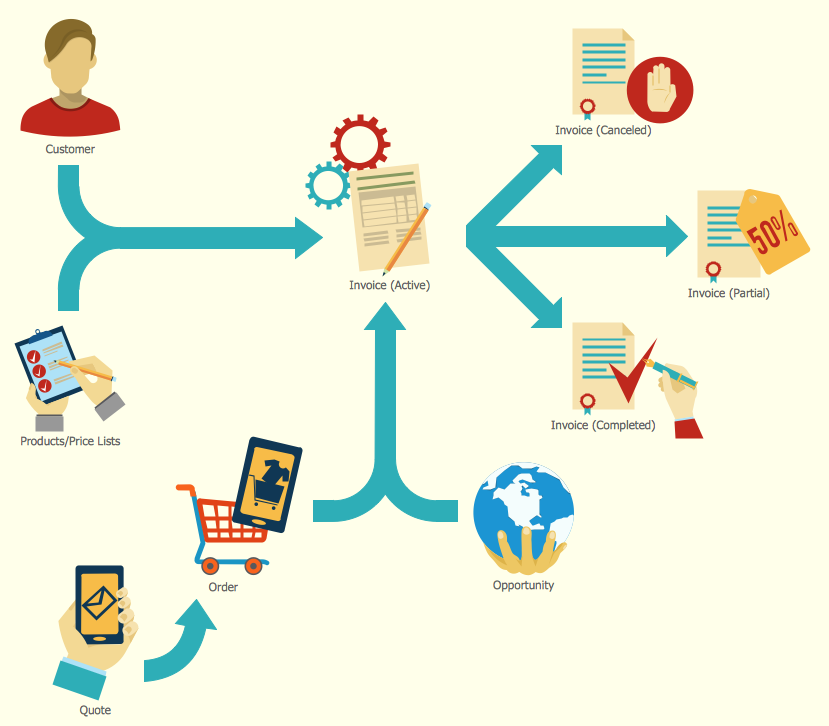
Example 1. Sales Process
Sales Flowcharts Solution offers wide variety of extensive drawing tools, collection of predesigned samples and 6 libraries with variety of predesigned vector shapes - sales themed graphics, symbols, and flowchart icons.
All these symbols are indispensable for outlining, analysis and refinement of a sales process, and also for easy creating informative sales process maps and flowcharts.

Example 2. Sales Process Flowchart
The Sales Process Flowcharts you see on this page were created in ConceptDraw DIAGRAM software using the vector shapes from the libraries of the Sales Flowcharts Solution. They successfully demonstrate solution's capabilities and professional results you can achieve. An experienced user spent 10 minutes creating each of them.
Use the tools of the Sales Flowcharts Solution for ConceptDraw Solution Park to create your own professional looking Sales Process Maps and Flowcharts quick, easy and effective.
All source documents are vector graphic documents. They are available for reviewing, modifying, or converting to a variety of formats (PDF file, MS PowerPoint, MS Visio, and many other graphic formats) from the ConceptDraw STORE. The Sales Flowcharts Solution is available for all ConceptDraw DIAGRAM
TEN RELATED HOW TO's:
A triangular graphic representing Graham's hierarchy of disagreement, based on Paul Graham's March 2008 essay How to Disagree.
Picture: Pyramid Diagram
Related Solutions:
Draw your own business process flowcharts using ConceptDraw DIAGRAM diagramming and business graphics software.
The Flowcharts Solution for ConceptDraw DIAGRAM is a comprehensive set of examples and samples in several different color themes for professionals that need to graphically represent a process.
Picture: Flow Chart Diagram Examples
Related Solution:
You need develop a business model? It’s very easy! All what you need is a powerful Business Process Diagram software. Never before creation of Business Models wasn’t so easy as now with Business Process Diagram Solution for ConceptDraw Solution Park.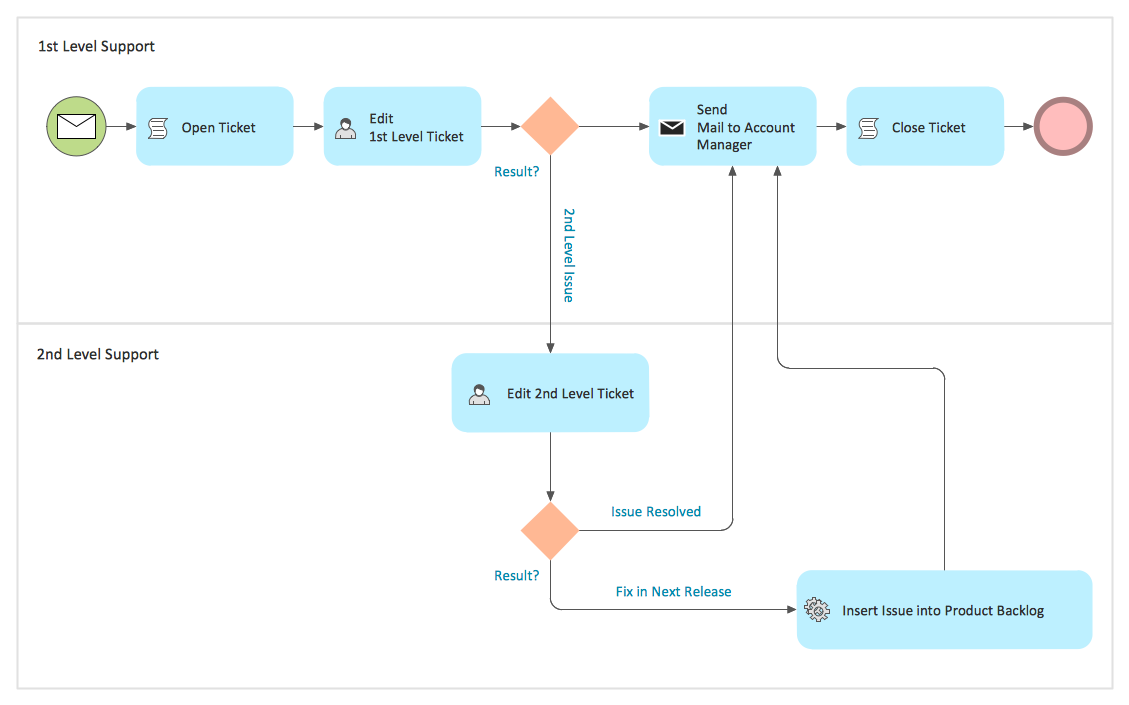
Picture: Business Models
Related Solution:
Job duties in small companies are usually spread randomly among workers, causing lots of problems and misunderstanding. One of the ways to restore order in business processing is to create a cross-functional flowchart with swim lanes that would represent every step in production system. Another advantage of using swim lanes flowchart is that it represents not only processes, but people responsible for them.
Swim lane diagram is a kind of a process flow diagram. Its special feature is that it joins the features of process flow diagrams with organizational charts. Thus, a swim lane diagram display a participant of the business process in a conjunction with general flow of the business system. A swim lane diagram is looks similar to a swimming pool's lanes. Lanes can be horizontal and vertical. The lanes are pointed out relatively to resource name, which is assigned on implementation of the given part of the business process. ConceptDraw Business Process Mapping solution delivers the ability to design develop swim lanes flowcharts using the vector graphic objects of Swim Lanes library.
Picture: Swim Lane Diagrams
Related Solution:
ConceptDraw DIAGRAM software extended with Picture Graphs solution is the best choice for making professional looking pictures of graphs and colorful picture graphs.
Picture: Pictures of Graphs
Related Solution:
This mind map demonstrates how the well-known Total Quality Management (TQM) methodology can be presented in a mind map. Using mind mapping for quality management is a creative approach that allows one to structure all key quality points on the one page.
Picture: Total Quality Management
Related Solution:
A Local Area Network (LAN) is a computer network that interconnects computers on the limited area such as a home, office building, school, bank, computer laboratory, etc.
ConceptDraw DIAGRAM is a powerful network diagramming and vector drawing software. It provides the Computer and Networks Area with many Solutions that contain the wide set ready-to-use predesigned vector stencils and examples to help you design the LANs quick and easy.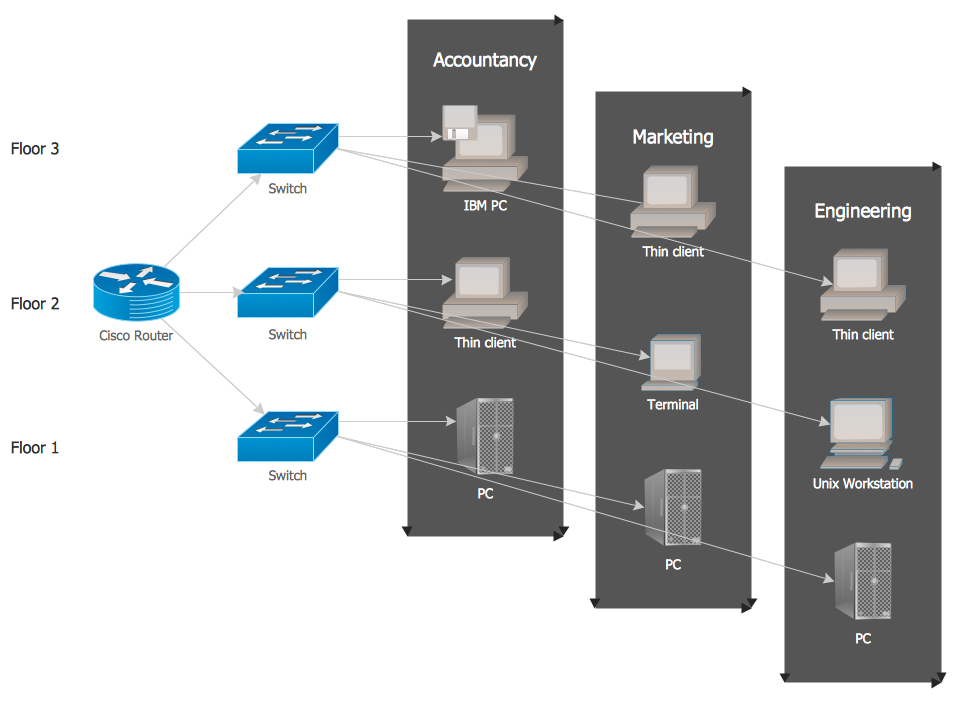
Picture: Local network area. Computer and Network Examples
Related Solution:
Creation of various types of Integration DEFinition (IDEF) diagrams - IDEF0, IDEF1X, IDEF2, IDEF3 and many other is a sufficiently complex process that requires powerful automated tools. ConceptDraw DIAGRAM diagramming and vector drawing software offers you such tool - IDEF Business Process Diagrams solution from the Business Processes area of ConceptDraw Solution Park.
Picture: Integration Definition
Related Solution:
To create an Audit Process FlowChart you only need Conceptdaw Software.
Picture: Basic Audit Flowchart. Flowchart Examples
Related Solution:
If you are just a beginner in drawing flowcharts, it may seem that a sheet of paper and a pen are just enough. However, at the time you would want to share your results, diagramming applications would suite you better. it’s very easy to create diagrams that way and to discover new kinds of flowcharts.
The huge collection of sample ConceptDraw diagrams, charts, illustrations and other types of business drawings includes a wide range of business themes. A huge number of graphic images of ConceptDraw documents is divides on business application areas according to business-oriented solutions for which they were made.Here is a short visual list of samples of flowcharts, process diagrams, UML models, management charts, computer network diagrams, maps, infographics, illustrations, etc. In short, each ConceptDraw solution is accompanied with at least ten samples representing some particular examples of the application of the given chart.
Picture: Applications


