Process Flow app for macOS
Use ConceptDraw DIAGRAM diagramming and business graphics software to draw your own flowcharts of computer algorithms.Create Flow Chart on Mac
A Flowchart is a commonly used type of chart that describes an algorithm, process or workflow. It applies the boxes of various kinds to represent the steps and connects them with arrows showing their order. The Flowcharts help to understand the processes, visualize the process steps, and effectively find the flaws and bottlenecks. They are widely used in various fields for analyzing, documenting, designing, and managing simple and complex processes and programs, for representing process operations and problems' solution models. There are many types of Flowcharts, such as Cross-Functional Flowcharts, Data Flow Diagrams, Swimlane Flowcharts, Workflow Diagrams, Business Process Diagrams, Process Flowcharts, etc. ConceptDraw DIAGRAM is a powerful diagram software used to create Flow chart on Mac and Windows without efforts. The Flowcharts solution from Diagrams area of ConceptDraw Solution Park and ConceptDraw Rapid Draw functionality are greatly effective tools for designing various types of Flowcharts for business processes.How to Draw an Effective Flowchart
Use ConceptDraw DIAGRAM diagramming and business graphics software to draw your own flowcharts of business processes.How To Create a Flow Chart in ConceptDraw
ConceptDraw DIAGRAM is a flowchart creating software. This software includes over 20 vector stencils in libraries. These objects allow you to create well-designed flowcharts. Put an initial object from library to a page and use RapidDraw technology clicking on direction arrows to add new objects to the flowchart. This way you can make flowchart quickly.Process Flow Chart Software Free
How to draw a Process Flow Chart? It's very fast and easy to draw any Process Flow Chart using the tools of special Process Flow Chart software free. Flowcharts Solution offers wide set of useful drawing tools, collection of samples, ready-to-use template and 2 libraries with predesigned vector elements which will help facilitate drawing process and designing professional looking process flow chart, process flow scheme, process block diagram, etc.Use the Best FlowChart Tool for the Job
The ConceptDraw DIAGRAM is a best flow chart tool for the job. The samples and templates included in the basic set allows users to draw any type of a flowchart. The vector stencils created by designers give ability to draw great-looking flowchart. Flowcharts give to users the ability to represent structural data visually.ConceptDraw PROJECT Project Management Software Tool
ConceptDraw PROJECT is simple project management software. If you are on the fast track in your career and start facing such challenges as coordination many people, coordination tasks and works, manage project with a great deal of time and money involved - it is the right time to get Project management tool involved in your work.How To Create a FlowChart using ConceptDraw
Have you ever needed a flowchart, but did not have the time or tools to build one? Rapid Draw allows you to build a professional flowchart quickly and easily. You have the ability to add your own shapes to Rapid Draw’s built in shape library.Best Flowcharts
Conceptdraw - feature-rich flowchart software. It will allow you to create professional looking flowcharts.Workflow Diagram Software Mac
ConceptDraw DIAGRAM software is the best Mac software for drawing workflow diagrams. Its rich set of samples and templates, and specific features to draw diagrams faster make this software as comfortable as possible for drawing workflow diagrams. Use the ConceptDraw DIAGRAM professional Mac OS X software for drawing workflow diagram. The Workflow Diagrams solution with its libraries and templates set make the possibility to identify resources that are required for work goal implementation. The process flow diagram identify flow which occurs as network of process dependencies, organizational decisions and interactions between departments. Usually workflow diagrams show business participants actions that carry product or service to the final destination, the consumer.Visual Presentations Made Easy with Diagramming Software
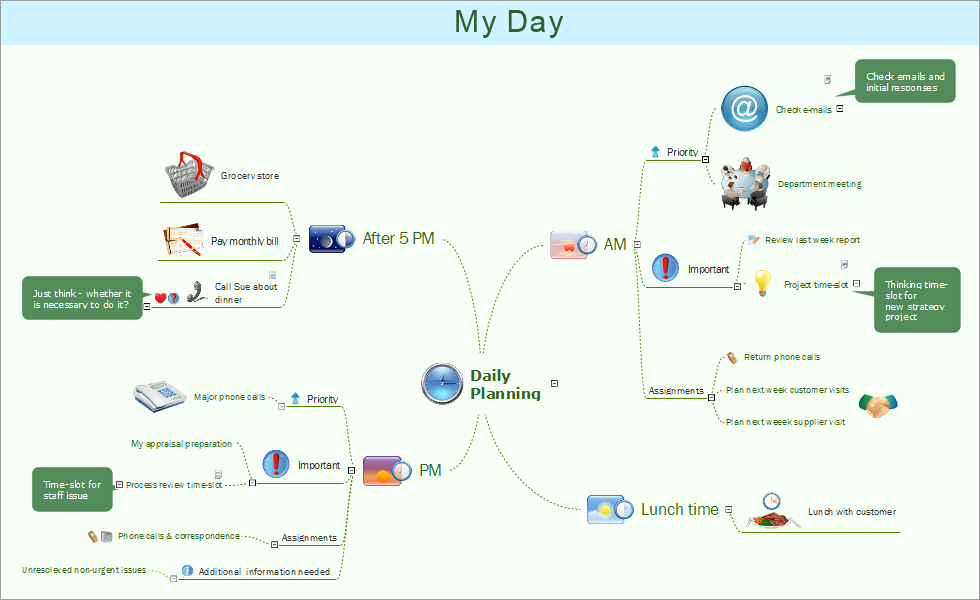
Automatically create a presentation-quality diagram in one click with ConceptDraw DIAGRAM.
Lean Manufacturing Diagrams
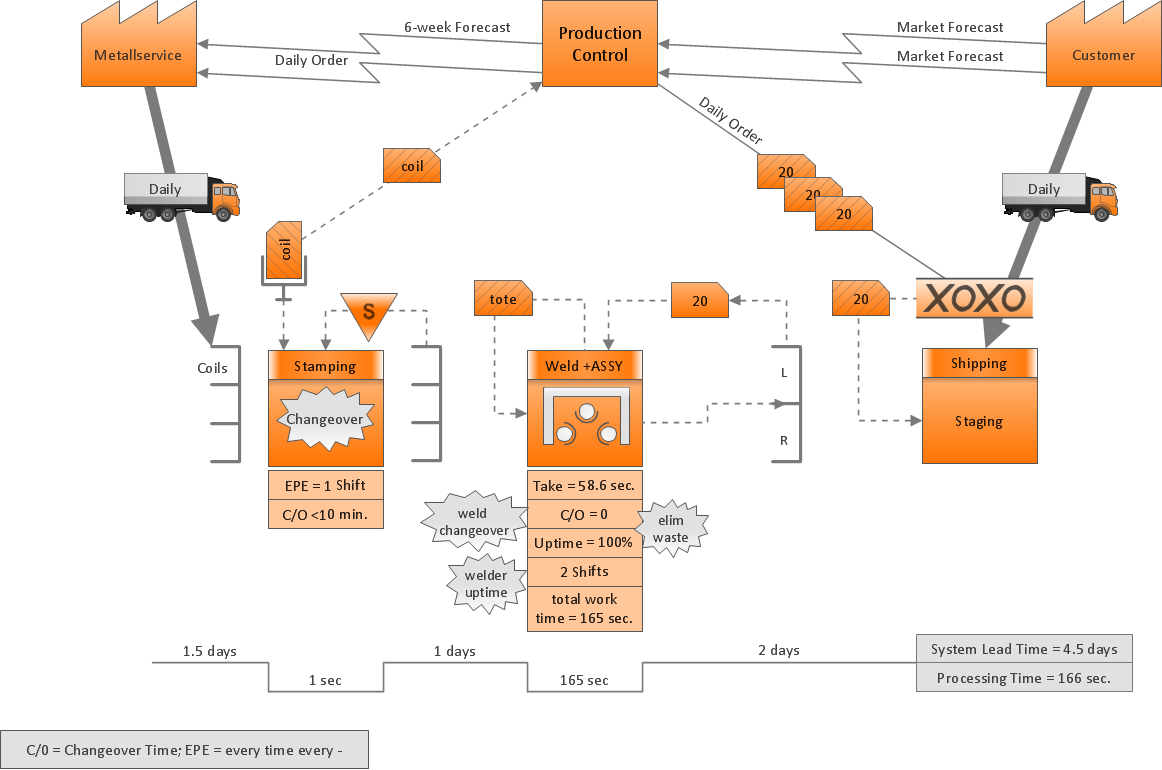
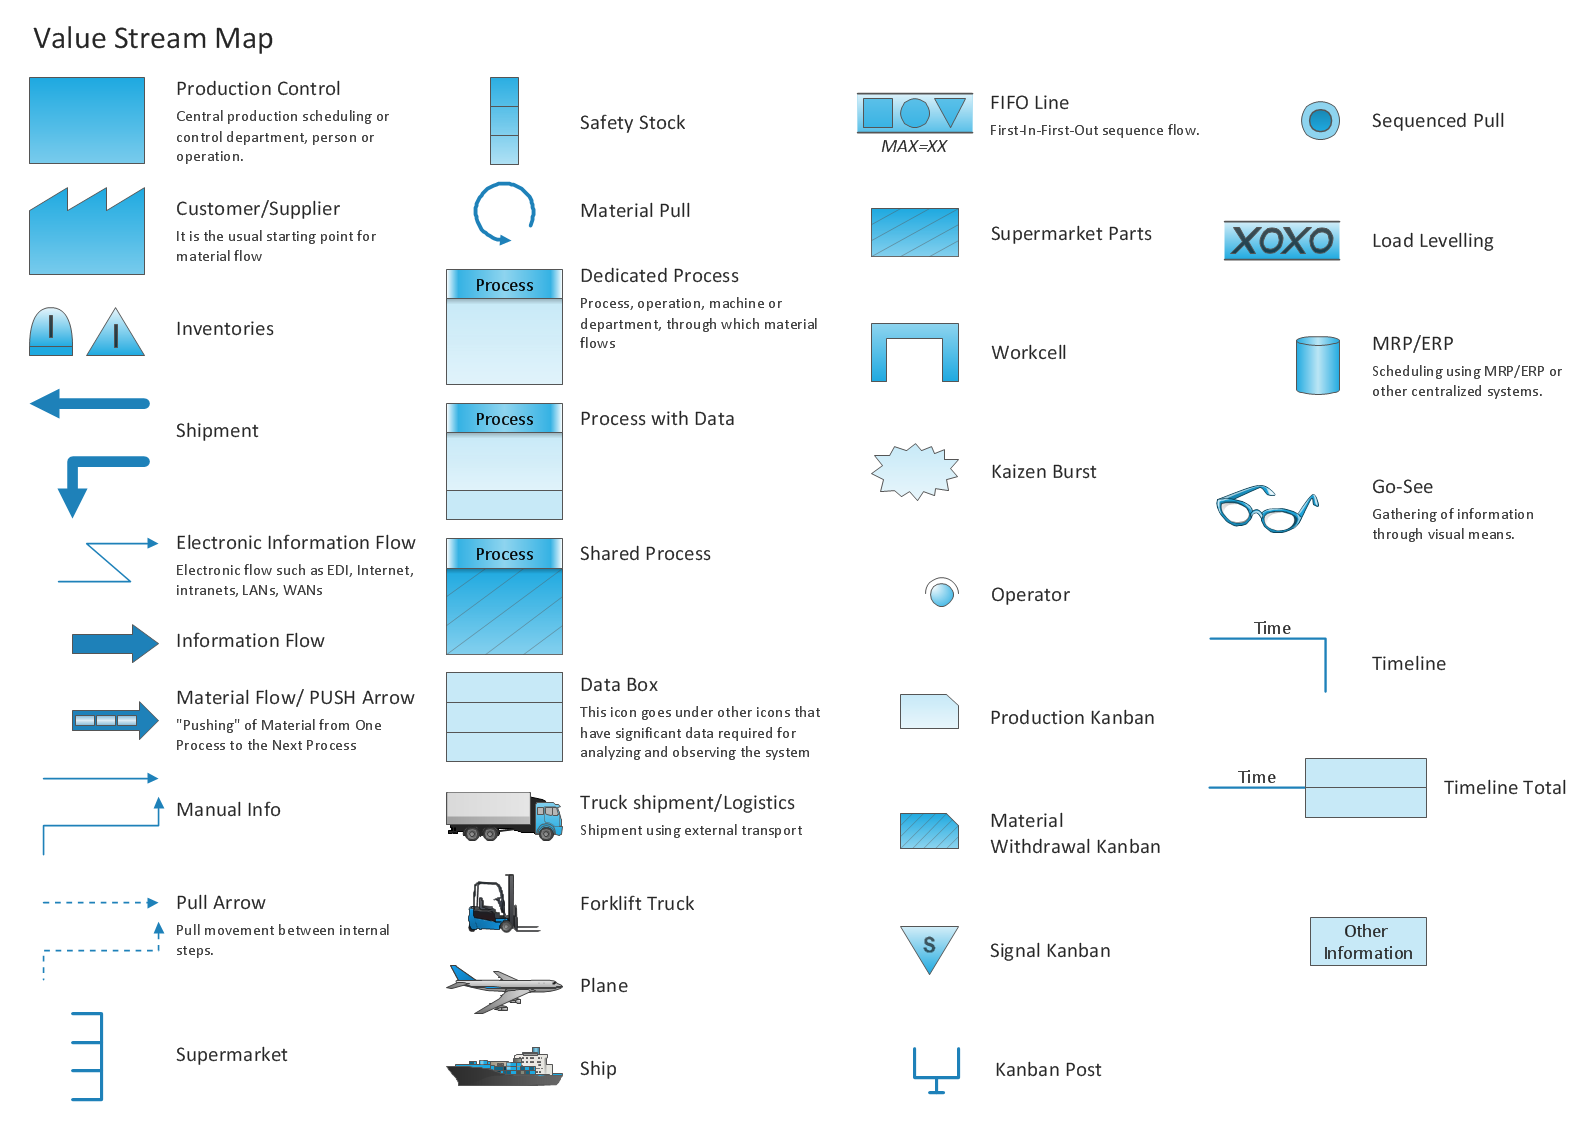
The Value Stream Mapping solution continues to extend the range of ConceptDraw DIAGRAM into a business graphics tool that can be used to document processes of Lean Manufacturing.Best Program to Make Flow Chart Diagrams
ConceptDraw the best business process modeling tool to make flow chart diagrams. Start creating your own flowchart with ConceptDraw DIAGRAM and accomplish great results in the moment. This is the best program to make flow chart diagrams that gives users the ability to simply draw any type of flowchart. The fast creating visualization for the structural data with the vector stencils from object libraries by using RapidDraw technology makes ConceptDraw DIAGRAM the first program in drawing flow data.Sales Process Map
You need create a Sales Process Map? Use the ConceptDraw DIAGRAM software which is ideal for the sales process management, marketing and engineering thanks to the powerful Sales Flowcharts solution from the Marketing area of ConceptDraw Solution Park.How To Send Presentation via Skype (Mac OS X)
New way to present documents via Skype conference call on Mac. All participants receive files. Presentation can be created automatically from plenty document formats.
Value Stream Mapping Presentations
Users can create Value Stream Mapping Presentations using presentation mode in ConceptDraw DIAGRAM.Fundamental Tool in Quality Management
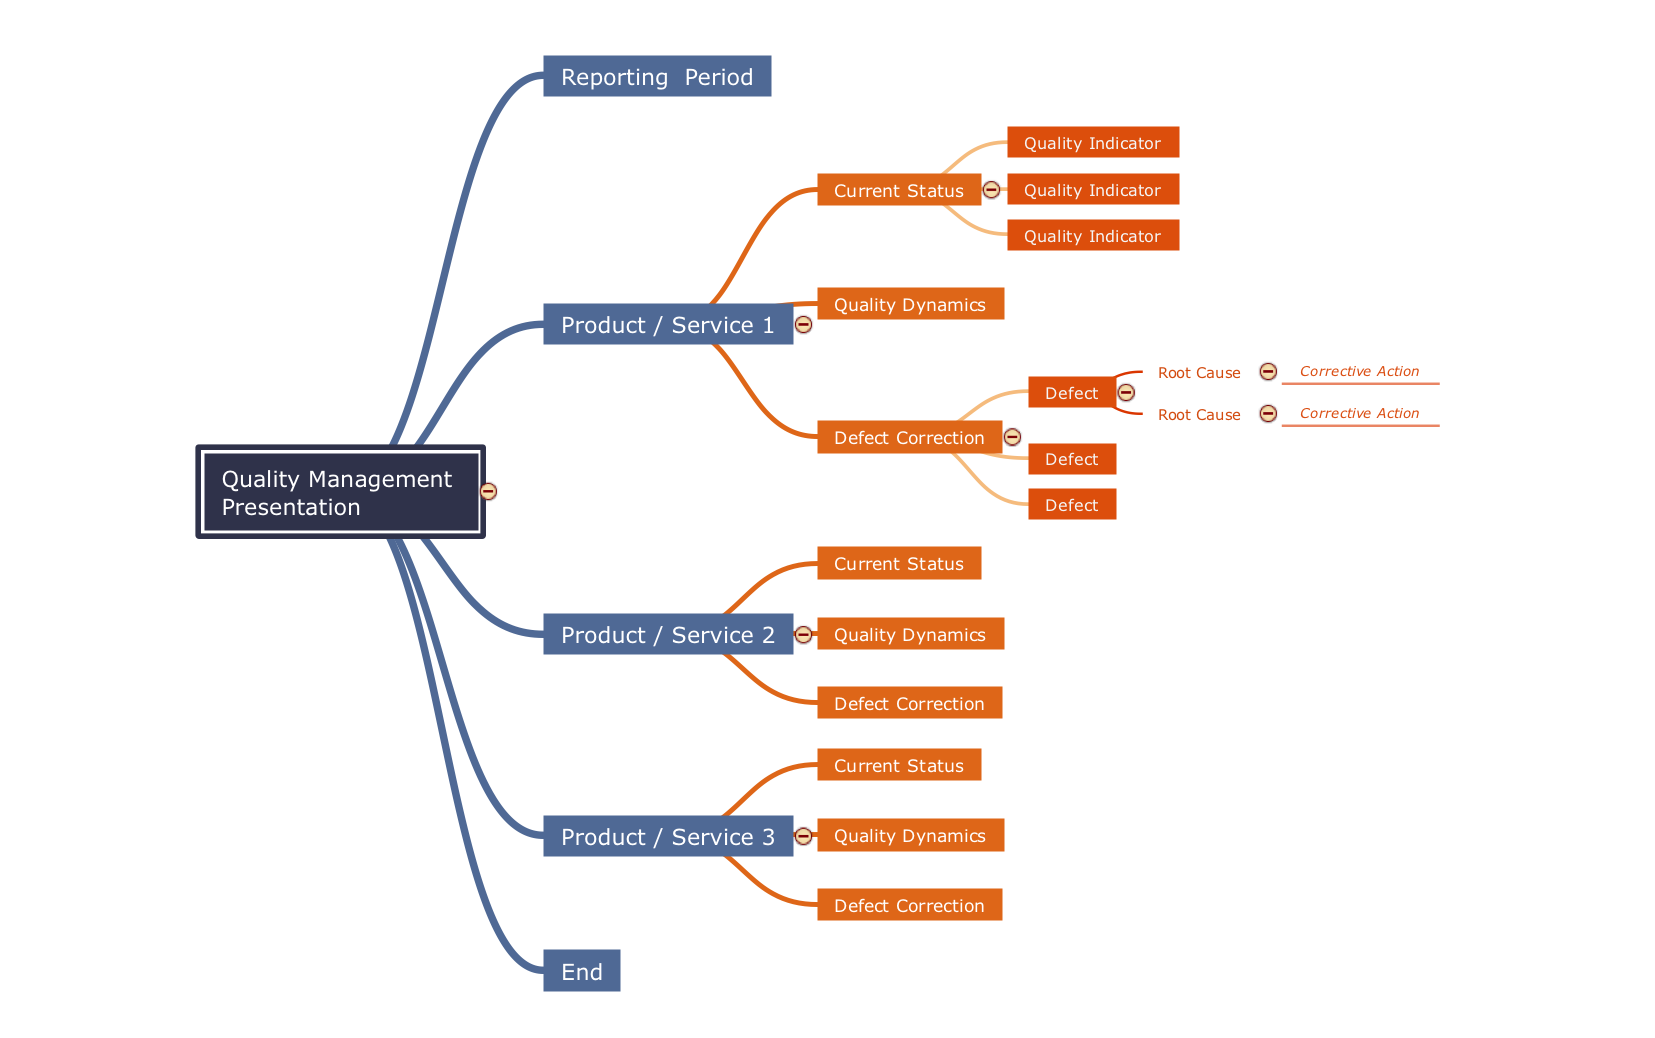
ConceptDraw MINDMAP is a fundamental tool in quality management to describe visual instructions on any process.Map Infographic Tool
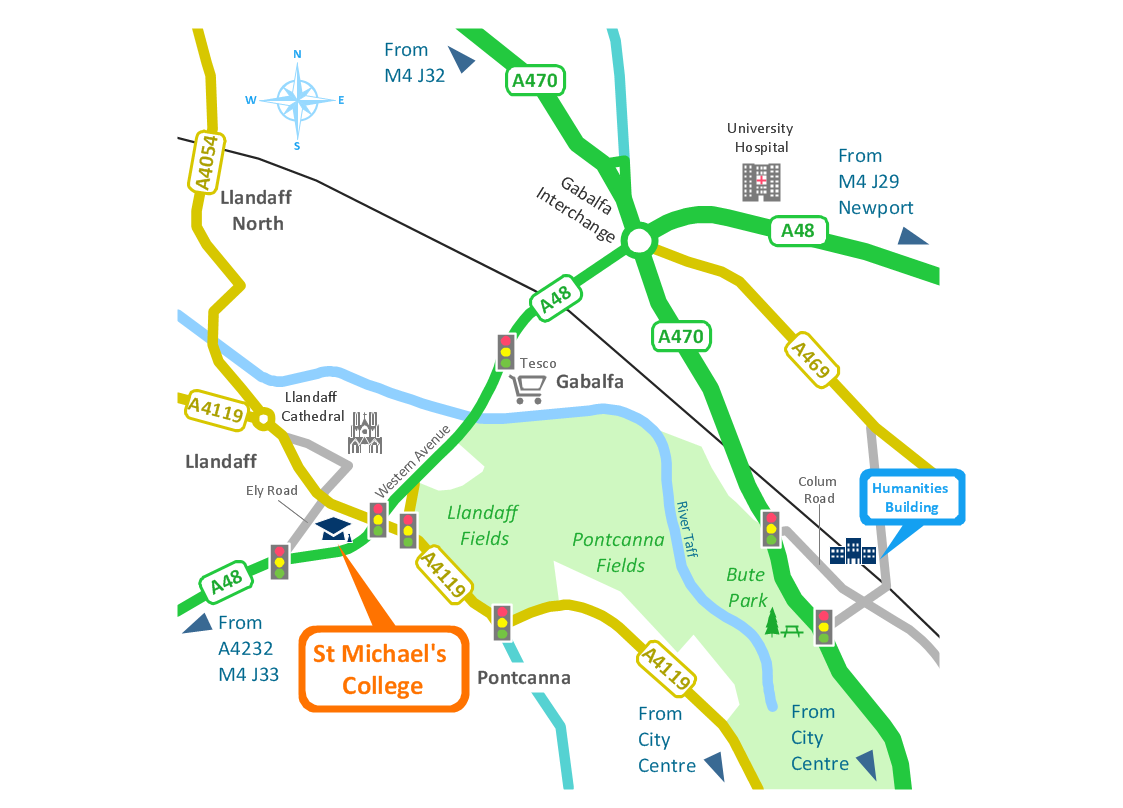
ConceptDraw is a data visualization tool, which can help you to create a map infographics. Anyone can do this, it's that easy!Value Stream Mapping Tool
Value Stream Mapping solution extends ConceptDraw DIAGRAM software with tools for drawing Value Stream Maps (VSM): templates, samples and library of vector stencils.Entity-Relationship Diagram (ERD) with ConceptDraw DIAGRAM
Entity-Relationship Diagram (ERD) is applied for detailed description of structures and high-level (conceptual) design databases using the Chen's and Crow's Foot notations. An ERD represents a diagram constructed mainly of rectangular blocks (for entities, data) linked with relationships. The links between the blocks are used to describe relations between the entities. There are three types of relationships: one-to-one, one-to-many, and many-to-many. Use the specialized ERD software - ConceptDraw DIAGRAM to create the Entity-Relationship Diagrams (ERDs) of any degree of complexity with Chen's and Crow's Foot notations. Draw them easily applying the powerful built-in tools and libraries of predesigned ERD vector objects from Entity-Relationship Diagram (ERD) solution from the Software Development area of ConceptDraw Solution Park. You can also start with one of ready template or sample included to this solution. Designing the ERDs in ConceptDraw DIAGRAM you can easy move the objects within a diagram with saving the relationships between them.
- Process Mapping Template Free Download Mac
- Process Flowchart | Business Process Mapping — How to Map a ...
- Business Process Modeling Software for Mac | Flow Diagram ...
- Free Business Process Modeler For Mac
- Basic Flowchart Symbols and Meaning | Process Flowchart | Swim ...
- How To Create a MS Visio Business Process Diagram | Basic ...
- Process Flowchart | Payroll process - Swim lane process mapping ...
- Good Flow Chart app for Mac | Process Flow app for macOS ...
- Cross-Functional Flowchart (Swim Lanes) | Swim Lane Diagrams ...
- Process Flow app for macOS | Good Flow Chart app for Mac | Flow ...
- Relationship Mapping Software Mac
- Cross-Functional Flowcharts | Cross-Functional Process Map ...
- Total Quality Management Definition | Process Flowchart | Block ...
- Chemical Engineering Process Flow Diagram Software Free
- Logistics Flow Charts | Process Flowchart | How to Make a Logistics ...
- Software Work Flow Process in Project Management with Diagram ...
- Process Flowchart | Basic Flowchart Symbols and Meaning ...
- Human Resources | Basic Flowchart Symbols and Meaning | Human ...
- Business Processes | Process Flowchart | How to Design an ...


