HelpDesk
How To Create an Affinity Diagram Using Solutions

Affinity Diagram Software

Affinity Diagram

Affinity Diagram

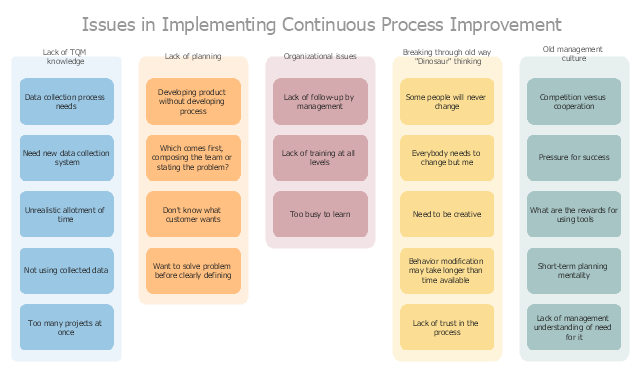
"A continual improvement process, also often called a continuous improvement process (abbreviated as CIP or CI), is an ongoing effort to improve products, services, or processes. These efforts can seek "incremental" improvement over time or "breakthrough" improvement all at once. Delivery (customer valued) processes are constantly evaluated and improved in the light of their efficiency, effectiveness and flexibility.
Some see CIPs as a meta-process for most management systems (such as business process management, quality management, project management, and program management)." [Continual improvement process. Wikipedia]
The affinity diagram example "Implementing continuous process improvement" was created using the ConceptDraw PRO diagramming and vector drawing software extended with the solution "Seven Management and Planning Tools" from the Management area of ConceptDraw Solution Park.
Affinity diagram
Affinity Diagram

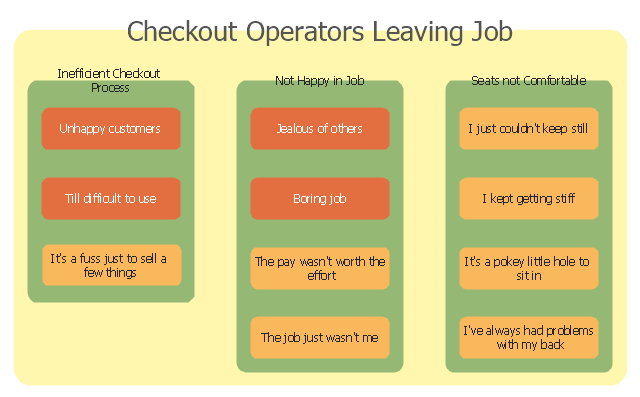
"Point of sale (also called POS or checkout) is the place where a retail transaction is completed. It is the point at which a customer makes a payment to the merchant in exchange for goods or services. At the point of sale the retailer would calculate the amount owed by the customer and provide options for the customer to make payment. The merchant will also normally issue a receipt for the transaction. ...
The modern point of sale is often referred to as the point of service because it is not just a point of sale but also a point of return or customer order. Additionally it includes advanced features to cater to different functionality, such as inventory management, CRM, financials, warehousing, etc., all built into the POS software. Prior to the modern POS, all of these functions were done independently and required the manual re-keying of information, which can lead to entry errors." [Point of sale. Wikipedia]
The affinity diagram example "Checkout operators leaving job" was created using the ConceptDraw PRO diagramming and vector drawing software extended with the solution "Seven Management and Planning Tools" from the Management area of ConceptDraw Solution Park.
Affinity diagram
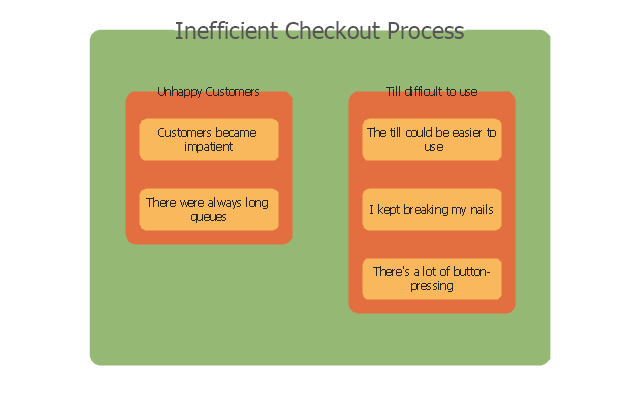
Inefficient checkout process
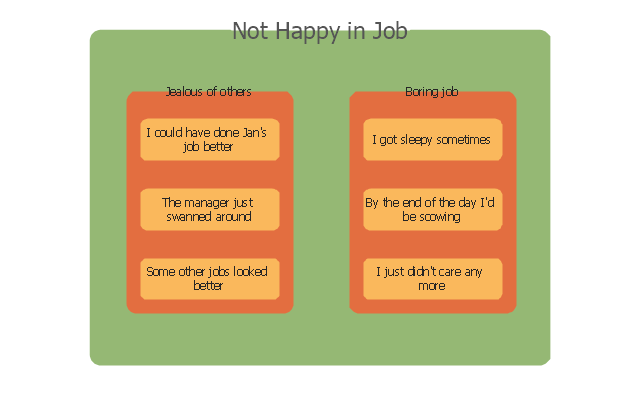
Not happy in job
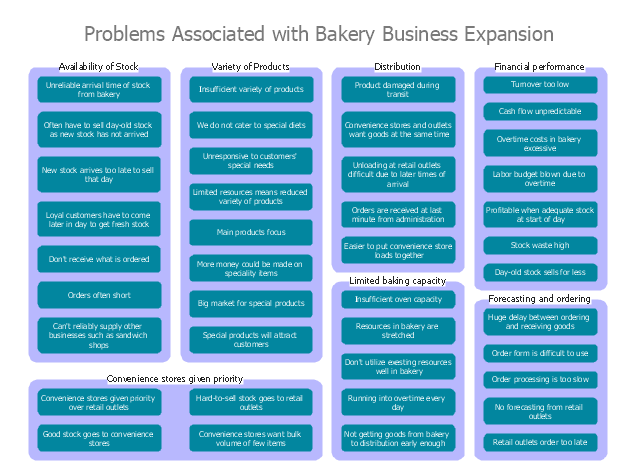
"An economic expansion is an increase in the level of economic activity, and of the goods and services available. It is a period of economic growth as measured by a rise in real GDP. The explanation of such fluctuations in aggregate economic activity is one of the primary concerns of macroeconomics.
Typically an economic expansion is marked by an upturn in production and utilization of resources. Economic recovery and prosperity are two successive phases of expansion. It may be caused by factors external to the economy, such as weather conditions or technical change, or by factors internal to the economy, such as fiscal policies, monetary policies, the availability of credit, interest rates, regulatory policies or other impacts on producer incentives. Global conditions may influence the levels of economic activity in various countries." [Economic expansion. Wikipedia]
"The term business cycle (or economic cycle or boom-bust cycle) refers to economy-wide fluctuations in production, trade and economic activity in general over several months or years in an economy organized on free-enterprise principles.
The business cycle is the upward and downward movements of levels of GDP (gross domestic product) and refers to the period of expansions and contractions in the level of economic activities (business fluctuations) around its long-term growth trend.
These fluctuations occur around a long-term growth trend, and typically involve shifts over time between periods of relatively rapid economic growth (an expansion or boom), and periods of relative stagnation or decline (a contraction or recession)." [Business cycle. Wikipedia]
The affinity diagram example "Business expansion" was created using the ConceptDraw PRO diagramming and vector drawing software extended with the solution "Seven Management and Planning Tools" from the Management area of ConceptDraw Solution Park.
Affinity diagram
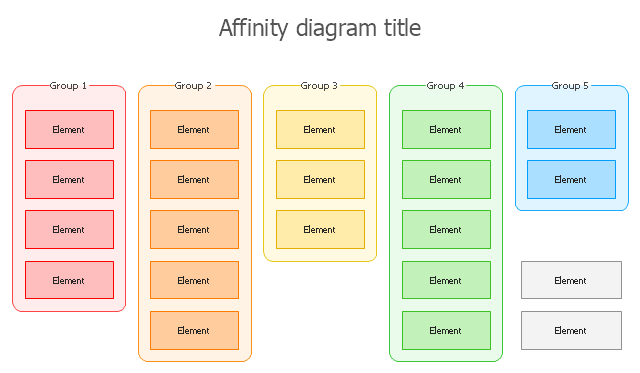
The affinity diagram shows the structure of complex factors that have an influence on a problem, and then divides them up into a smaller and simpler structure. This diagram is designed to prepare the data for further analysis of the cause-effect relationships.
"Affinity diagrams are a special kind of brainstorming tool that organize large amounts of disorganized data and information into groupings based on natural relationships.
It was created in the 1960s by the Japanese anthropologist Jiro Kawakita. Its also known as KJ diagram,after Jiro Kawakita.When to Use an Affinity Diagram: 1) When you are confronted with many facts or ideas in apparent chaos. 2) When issues seem too large and complex to grasp." [Seven Management and Planning Tools. Wikipedia]
The affinity diagram is one of the Seven Management and Planning Tools (7 MP tools, Seven New Quality Tools).
The affinity diagram template for the ConceptDraw PRO diagramming and vector drawing software is included in the solution "Seven Management and Planning Tools" from the Management area of ConceptDraw Solution Park.
Affinity diagram template
 Seven Management and Planning Tools
Seven Management and Planning Tools solution extends ConceptDraw DIAGRAM and ConceptDraw MINDMAP with features, templates, samples and libraries of vector stencils for drawing management mind maps and diagrams.
PROBLEM ANALYSIS. Identify and Structure Factors


Problem Analysis

The Action Plan

PROBLEM ANALYSIS. Prioritization Matrix

Cause and Effect Analysis

Radar Chart

UML Class Diagram


PDPC

Drawing Workflow Diagrams

House of Quality Matrix Software

- Affinity Diagram | Affinity Diagram | Root Cause Tree Diagram ...
- Affinity Diagram | How To Create Onion Diagram | Affinity Diagram ...
- Total Quality Management | Affinity Diagram | PROBLEM ANALYSIS ...
- Affinity Diagram | PDPC | PROBLEM ANALYSIS. Root Cause ...
- Affinity Diagram | Affinity Diagram Software | Affinity Diagram | Best ...
- Affinity Diagram | Affinity Diagram | How To Create an Affinity ...
- Affinity diagram - Implementing continuous process improvement ...
- Affinity diagram - Implementing continuous process improvement
- Affinity Diagram Software | Affinity Diagram | Affinity Diagram | Pdf ...
- Affinity Diagram | Affinity Diagram Software | Affinity Diagram ...
- Affinity diagram - Template
- Affinity Diagram | Affinity Diagram Software | Affinity diagram ...
- Affinity Diagram | Affinity Diagram Software | How To Create an ...
- Use the Best FlowChart Tool for the Job | Affinity diagram - Checkout ...
- Affinity diagram - Checkout operators leaving job
- Affinity Diagram | Affinity diagram - Template | How To Create an ...
- Affinity diagram - Business expansion
- How To Create an Affinity Diagram Using ConceptDraw Office | How ...
- Affinity Diagram | Prioritization Matrix | Seven Management and ...