Value Stream Mapping Tool
The new Value Stream Mapping solution found in the ConceptDraw Solution Park continues to extend the range of ConceptDraw DIAGRAM into a business graphics tool that can be used to document processes in any organization. ConceptDraw DIAGRAM is the best Value Stream Mapping software tool.

Pic.1 Value Stream Mapping (VSM) diagram vector stencils.
Value Stream Mapping solution extends ConceptDraw DIAGRAM software with tools for drawing Value Stream Maps (VSM): templates, samples and library of vector stencils.
See also Samples:
SEVEN RELATED HOW TO's:
The library with 40 vector stencils is included in the ConceptDraw Value Stream Mapping solution.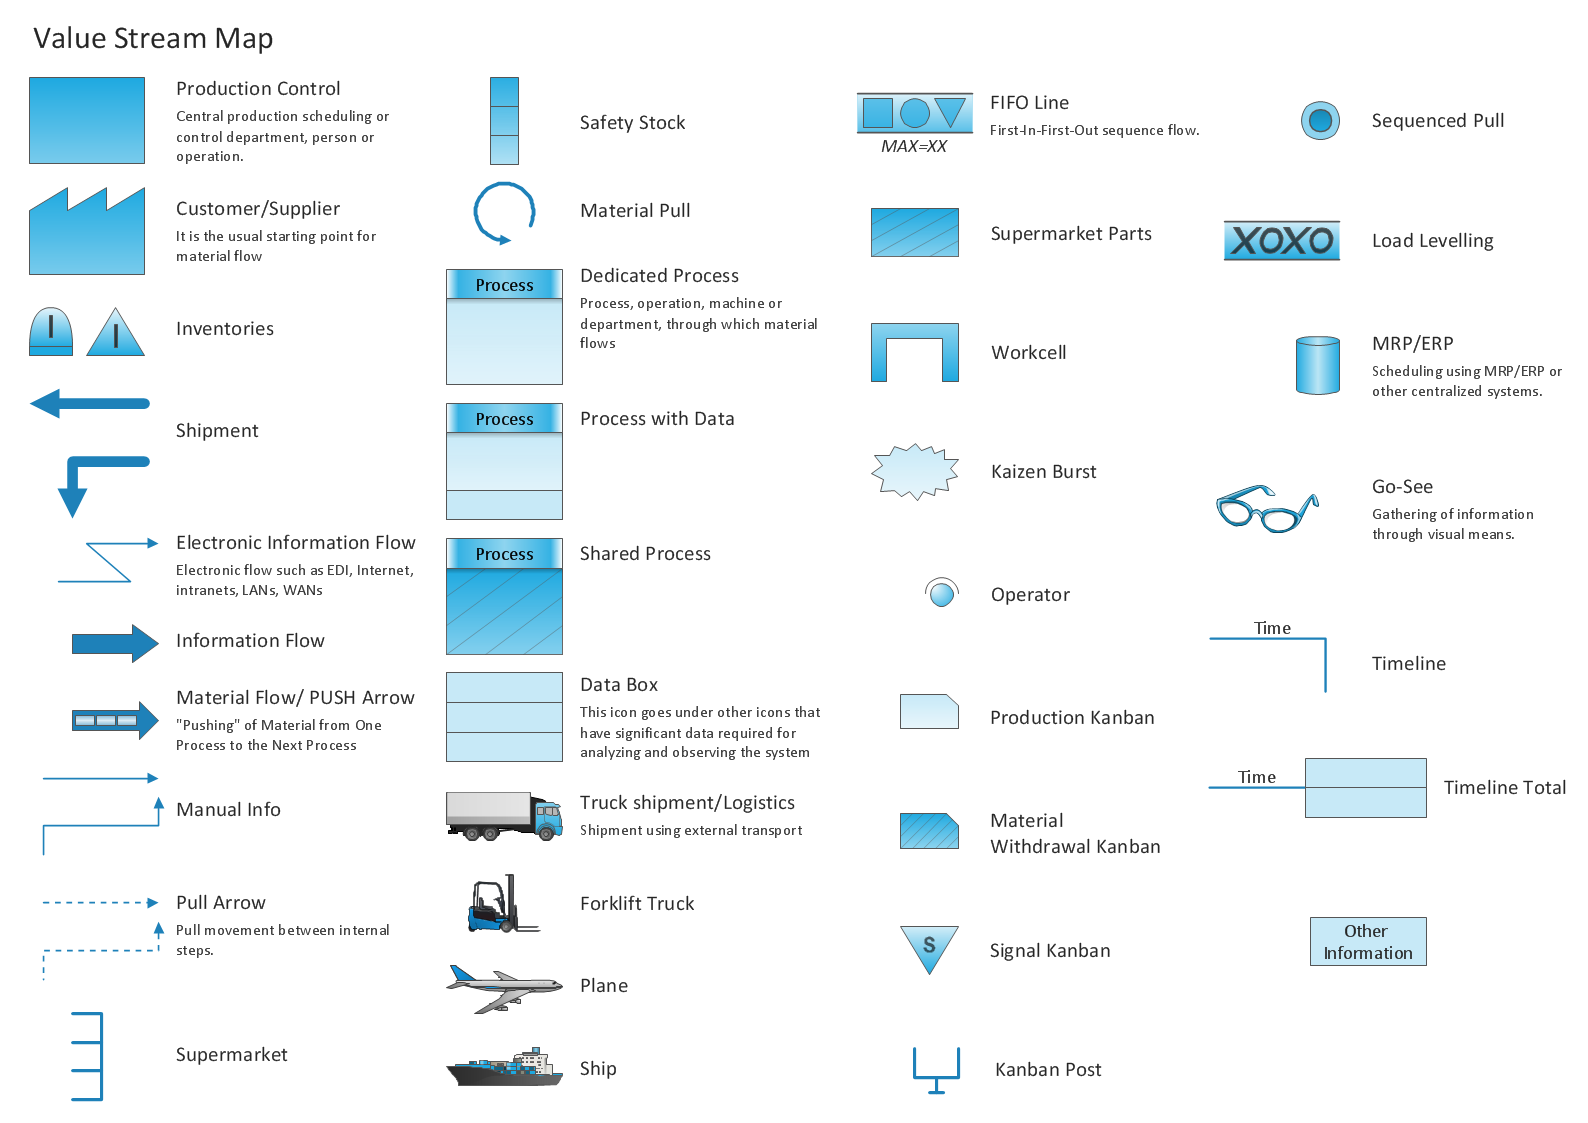
Picture: Value Stream Mapping Icons
Related Solution:
Event-Driven Process Chain Diagrams for improvement throughout an organisation.
ConceptDraw DIAGRAM - software that reduces the time needed to create a business process model.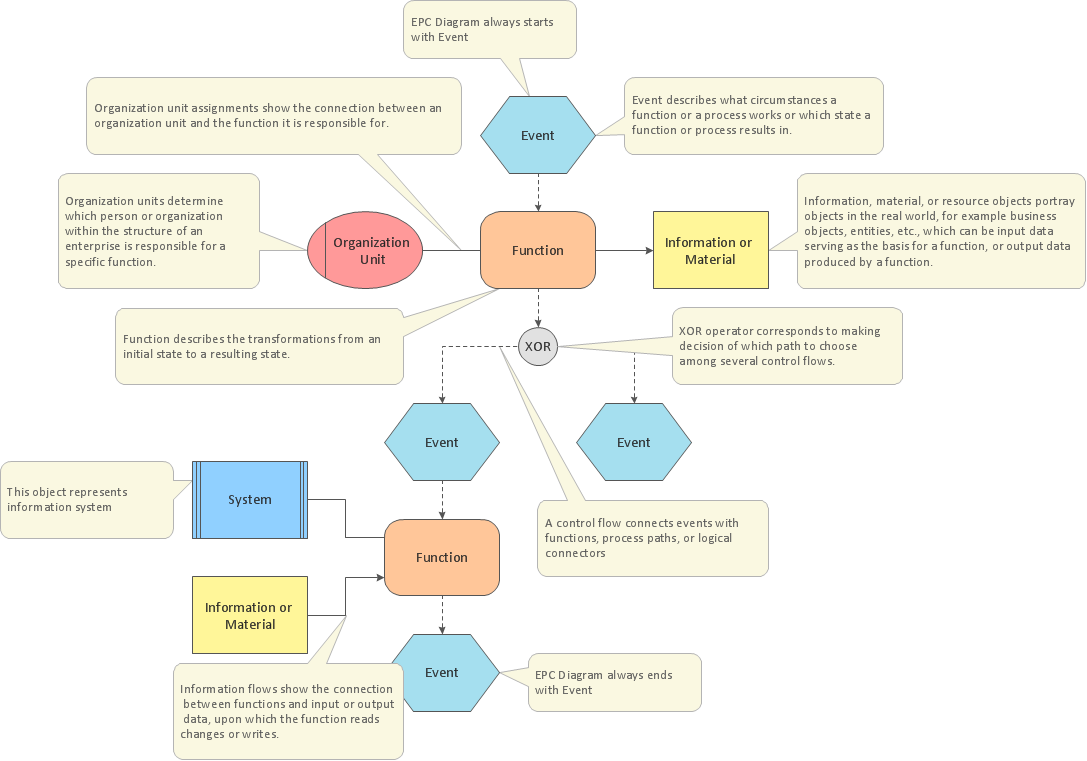
Picture: Business Process Modeling with EPC
Related Solution:
ConceptDraw MINDMAP with the ability to import presentations from Microsoft PowerPoint, as well as enhancing its existing presentation capabilities.
Picture: Best Mind Mapping Program for Making Presentations
Related Solution:
A requisition form is one of the documents used for accounting in different manufacturing processes. There are two main types of requisition: a purchasing requisition and material requisition and difference between them is significant. Creating a flowchart might help you in understanding all the details of accounting process.
Flowcharts are a best visual method for dividing a large and complicated procedure into a several little clear pieces. The main value-ability of an effective flowchart is its simpleness. Material requisition flowcharts are used to document the process of relationships between the different departments and the purchasing department within an organization. The flow chart gives the step-by-step guide on how is carried out the procurement process of the materials necessary for the functioning of the organization. This type of flowchart along with many other business flowcharts, one can easy create using ConceptDraw Flowcharts solution.
Picture: Material Requisition Flowchart. Flowchart Examples
Related Solution:
VSM →
Value stream mapping is a lean-management method for analyzing the current state and designing a future state for the series of events that take a product or service from its beginning through to the customer. ConceptDraw DIAGRAM diagramming and vector drawing software extended with Value Stream Mapping solution from the Quality area of ConceptDraw Solution Park is effective for implementation a value stream mapping (VSM) process and for creating Value Stream Maps.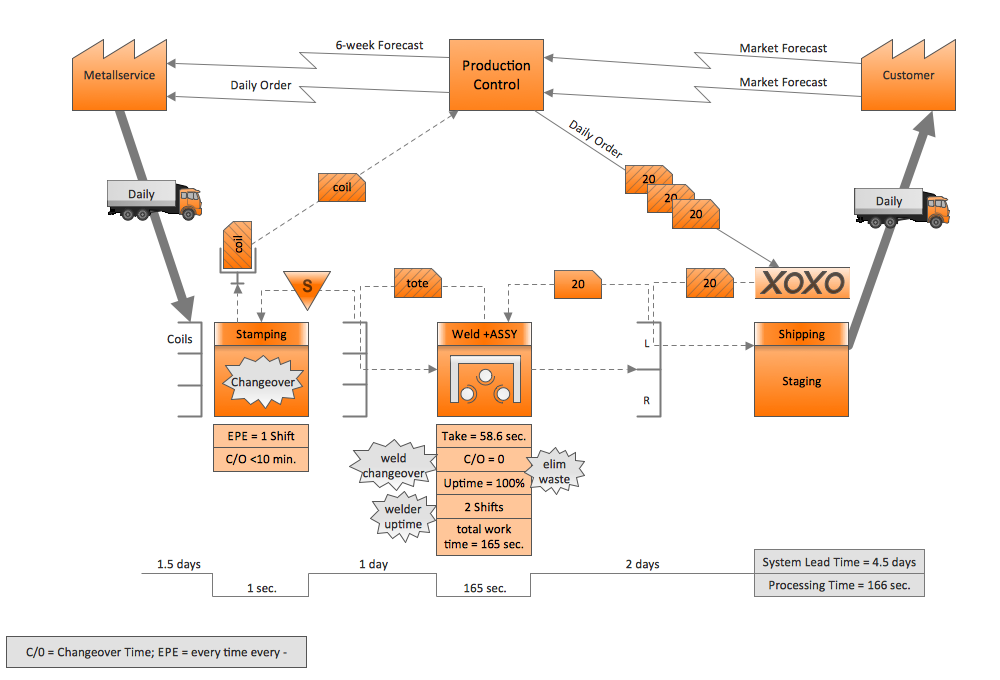
Picture: VSM
Related Solution:
Users can create Value Stream Mapping Presentations using presentation mode in ConceptDraw DIAGRAM.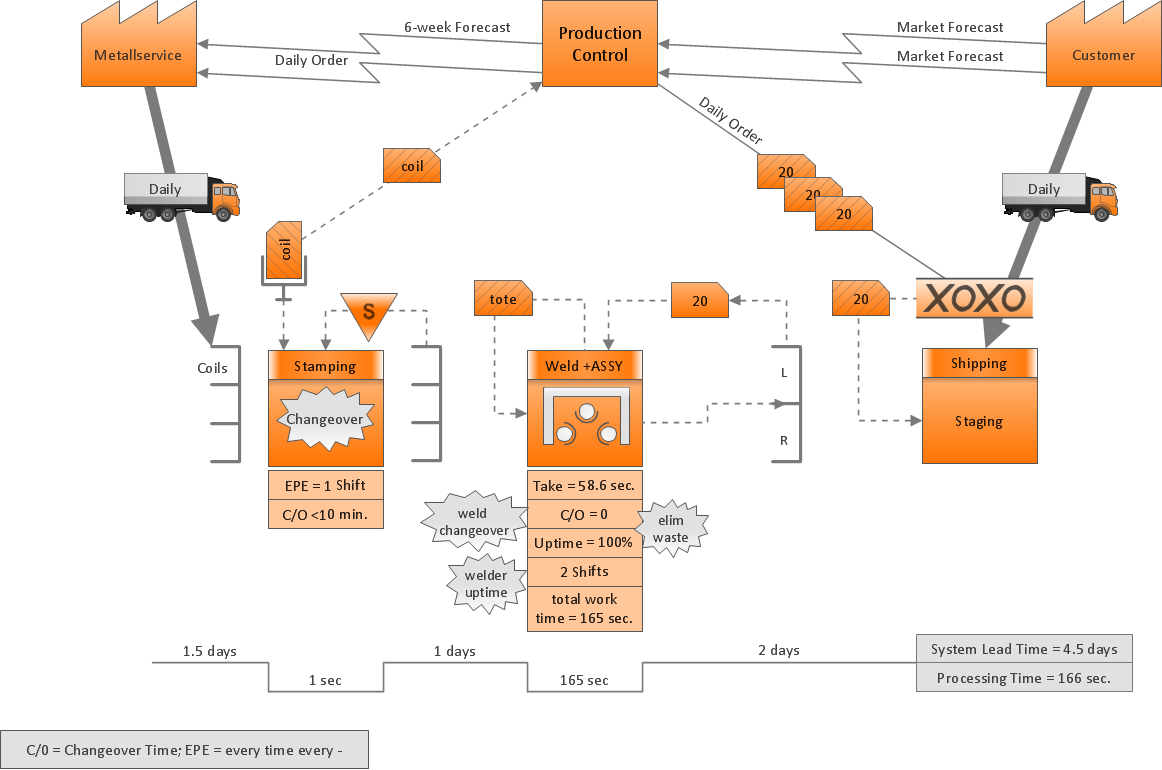
Picture: Value Stream Mapping Presentations
Related Solution:
If you ever wanted to try any diagramming tools except of Visio, but were afraid to lose existing documents, there’s good news for you. One of the most striking features of ConceptDraw DIAGRAM is it’s perfect compatibility with MS Visio, which guarantees that you won’t depend on operating system anymore, because another ConceptDraw DIAGRAM feature is that it’s cross-platform tool. Don’t waste your time looking for other options, you’ve found the solution already!
Business professionals often utilize the MS Visio as a common tool for making various issues on business visualization. MS Visio is a strong software with good capacity to maintain complex business solutions. But there is no MS Visio for Apple OS X. This is a large invocation, and one would be pleased to recognize that ConceptDraw DIAGRAM is the ideal alternative to MS Visio. Primarily, because this software works natively on both Windows and Apple OS X platforms. if you have migrated from Windows to Mac, or need to communicate in a cross-platform conditions, you’ll search for MS Visio replacer. ConceptDraw DIAGRAM is the exclusive professional business diagramming application that runs on both Windows and Apple OS X. The opportunity exchange files between PC and Mac, as well as between ConceptDraw DIAGRAM and Visio is the significant advantage that permits you to display and to collaborate business information in effortless and cost-effective way.
Picture: ConceptDraw DIAGRAM Compatibility with MS Visio
ConceptDraw
MINDMAP 16