HelpDesk
How to Create a Sales Flowchart

Sales Process FlowchartFlowchart Examples

Marketing and Sales Organization chart. Organization chart Example

Marketing Analysis Diagram

Example Process Flow

 Sales Flowcharts
The Sales Flowcharts solution lets you create and display sales process maps, sales process workflows, sales steps, the sales process, and anything else involving sales process management.
Sales Growth. Bar Graphs Example

 Marketing Diagrams
Marketing Diagrams solution extends ConceptDraw DIAGRAM diagramming software with abundance of samples, templates and vector design elements intended for easy graphical visualization and drawing different types of Marketing diagrams and graphs, including Branding Strategies Diagram, Five Forces Model Diagram, Decision Tree Diagram, Puzzle Diagram, Step Diagram, Process Chart, Strategy Map, Funnel Diagram, Value Chain Diagram, Ladder of Customer Loyalty Diagram, Leaky Bucket Diagram, Promotional Mix Diagram, Service-Goods Continuum Diagram, Six Markets Model Diagram, Sources of Customer Satisfaction Diagram, etc. Analyze effectively the marketing activity of your company and apply the optimal marketing methods with ConceptDraw DIAGRAM software.
Sales Process Map

Sales Process Flowcharts

Sales Process Flowchart Symbols

Pyramid Diagram and Pyramid Chart

Types of Welding in Flowchart

Sales Process Steps

This flowchart example was created on the base of land sales process diagram from the Property management webpage of the VicRoads website.
[www.vicroads.vic.gov.au/ planning-and-projects/ property-services/ property-management]
"VicRoads or the Roads Corporation of Victoria is a statutory corporation which is the state road and traffic authority in the state of Victoria, Australia. It is responsible for maintenance and construction of the state arterial road network, as well as driver licensing and vehicle registration. VicRoads has broad responsibility for road safety policy and research. It is also responsible for regulating the accident towing industry in Victoria." [VicRoads. Wikipedia]
"Sales Process.
Once it has been established with the relevant VicRoads Regions/ Projects and other business areas that properties are identified as surplus to VicRoads’ operational needs, they are incorporated in the VicRoads annual sales program.
Following approval: relevant VicRoads Regional Manager and the VicRoads Chief Executive (and in some circumstances Minster for Public Transport and Roads) must approve all land deemed surplus and available for disposal.
The method of sale is then determined and consultant advice is sought:
(1) Planning.
(2) Valuer General Victoria (Valuer General’s office must provide a valuation for all sales).
(3) Government Land Monitor (Land Monitor approval is sought if the value exceeds $750,000).
(4) Environmental.
(5) Local Council." [www.vicroads.vic.gov.au/ planning-and-projects/ property-services/ property-management]
The example "Land sales process flowchart" was created using the ConceptDraw PRO diagramming and vector drawing software extended with the Sales Flowcharts solution from the Marketing area of ConceptDraw Solution Park.
Sales process chart

Sales Process

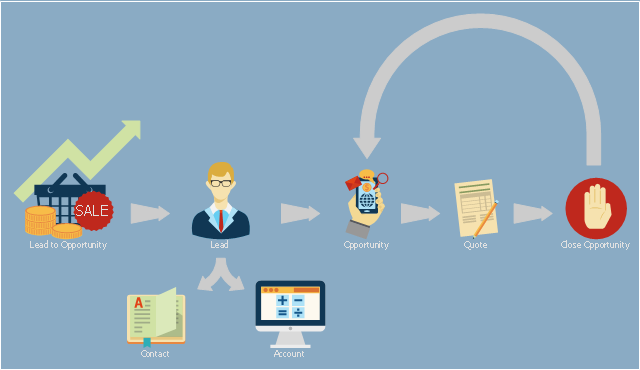
This presales process flowchart example depicts the Microsoft Dynamics CRM workflow from lead to opportunity. It was redesigned from the Wikimedia Commons file: Lead to Opportunity sales flow.svg. [commons.wikimedia.org/ wiki/ File:Lead_ to_ Opportunity_ sales_ flow.svg]
"Presales is a process or a set of activities normally carried out before a customer is acquired, though sometimes presales also extends into the period the product or service is delivered to the customer. ...
In a typical sales cycle the stages are:
(1) Contact.
(2) Lead / Suspect.
(3) Prospect / Opportunity.
The task of a presales person starts from the initial contact phase and often ends once the customer is acquired i.e. sale is made." [Presales. Wikipedia]
The process flowchart example "Lead to opportunity sales flow" was created using the ConceptDraw PRO diagramming and vector drawing software extended with the Sales Flowcharts solution from the Marketing area of ConceptDraw Solution Park.
Presales process flowchart
Sales Steps

Flowchart Program Mac

The Sales Process

- Flowchart Marketing Process . Flowchart Examples | Flowchart ...
- Sales Flowcharts | Flowchart Marketing Process . Flowchart ...
- Flowchart Marketing Process . Flowchart Examples | Flowchart ...
- Flowchart Marketing Process . Flowchart Examples | Business ...
- Sales Process Flowchart Symbols | Sales And Marketing Of Hotel ...
- Cross-Functional Flowcharts | Marketing Function Flowchart
- Flowchart Marketing Process . Flowchart Examples | Marketing Flow ...
- Flowchart Marketing Process . Flowchart Examples | Marketing Flow ...
- Flowchart Marketing Process . Flowchart Examples | Marketing Flow ...