 Target and Circular Diagrams
This solution extends ConceptDraw DIAGRAM software with samples, templates and library of design elements for drawing the Target and Circular Diagrams.
Circle Spoke Diagram Template

Best Diagramming


Circular Diagram

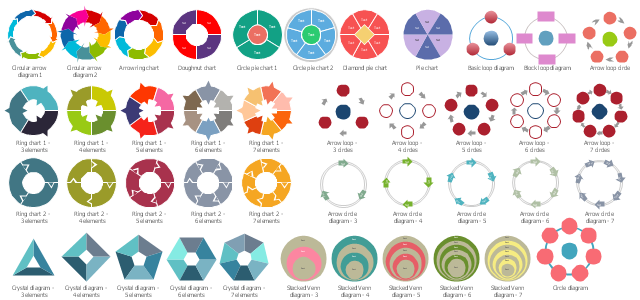
The vector stencils library "Circular diagrams" contains 42 templates of circular diagrams: circular arrow diagram, circular motion diagram, arrow ring chart, doughnut chart (donut chart), circle pie chart, diamond pie chart, circle diagram, pie chart, ring chart, loop diagram, block loop diagram, arrow loop circle, crystal diagram, triangular diagram, diamond diagram, pentagon diagram, hexagon diagram, heptagon diagram, cycle diagram (cycle chart), stacked Venn diagram (onion diagram), arrow circle diagram.
The example of marketing diagrams templates "Design elements - Circular diagrams" for the ConceptDraw PRO diagramming and vector drawing software is included the Target and Circular Diagrams solution from the Marketing area of ConceptDraw Solution Park.
www.conceptdraw.com/ solution-park/ marketing-target-and-circular-diagrams
Circular diagrams templates
Circular Flow Diagram Template

"A target market is a group of customers that the business has decided to aim its marketing efforts and ultimately its merchandise towards. A well-defined target market is the first element to a marketing strategy. The marketing mix variables of product, place (distribution), promotion and price are the four elements of a marketing mix strategy that determine the success of a product in the marketplace." [Target market. Wikipedia]
"An onion diagram is a kind of chart that shows the dependencies among parts of an organization or process. The chart displays items in concentric circles, where the items in each ring depend on the items in the smaller rings. ...
The Onion Diagram is able to show layers of a complete system in a few circles. Each of the circles is able to represent a component that is dependent upon the component on the inside of it shown by the circle inside of it. The main concept of the diagram is shown by the center circle of the diagram. This chart is used due to the fact that it has a clear visual representation that is easy to read, and it has a strong visual impact." [Onion diagram. Wikipedia]
This onion diagram (target diagram) example "Target market" was created using the ConceptDraw PRO diagramming and vector drawing software extended with the Target and Circular Diagrams solution from the Marketing area of ConceptDraw Solution Park.
www.conceptdraw.com/ solution-park/ marketing-target-and-circular-diagrams
Onion diagram

The vector stencils library "Circular diagrams" contains 42 templates of circular diagrams: circular arrow diagram, circular motion diagram, arrow ring chart, doughnut chart (donut chart), circle pie chart, diamond pie chart, circle diagram, pie chart, ring chart, loop diagram, block loop diagram, arrow loop circle, crystal diagram, triangular diagram, diamond diagram, pentagon diagram, hexagon diagram, heptagon diagram, cycle diagram (cycle chart), stacked Venn diagram (onion diagram), arrow circle diagram.
Use these shapes to illustrate your marketing and sales documents, presentations, webpages and infographics in the ConceptDraw PRO diagramming and vector drawing software extended with the Target and Circular Diagrams solution from the Marketing area of ConceptDraw Solution Park.
www.conceptdraw.com/ solution-park/ marketing-target-and-circular-diagrams
Circular arrow diagram 1
Circular arrow diagram 2
Arrow ring chart
Doughnut chart

Diamond pie chart

Pie chart

Circle diagram

Circle pie chart 2

Circle pie chart 1

Ring chart 1 - 3 elements

Ring chart 1 - 4 elements

Ring chart 1 - 5 elements

Ring chart 1 - 6 elements

Ring chart 1 - 7 elements

Ring chart 2 - 3 elements

Ring chart 2 - 4 elements

Ring chart 2 - 5 elements

Ring chart 2 - 6 elements

Ring chart 2 - 7 elements

Crystal diagram - 3 elements

Crystal diagram - 4 elements

Crystal diagram - 5 elements

Crystal diagram - 6 elements

Crystal diagram - 7 elements

Stacked Venn diagram - 4

Stacked Venn diagram - 5

Stacked Venn diagram - 6

Stacked Venn diagram - 7

Basic loop diagram

Block loop diagram

Arrow loop circle
Arrow loop - 3 circles
Arrow loop - 4 circles
Arrow loop - 5 circles
Arrow loop - 6 circles
Arrow loop - 7 circles
Arrow circle diagram - 3
Arrow circle diagram - 4
Stacked Venn diagram - 3

Arrow circle diagram - 5
Arrow circle diagram - 6
Arrow circle diagram - 7
Target Diagram

Pie Donut Chart. Pie Chart Examples

Business Report Pie. Pie Chart Examples

The Circular Flow Diagram

Scatter Graph Charting Software

"Brand essence is a phrase that communicates the fundamental nature of a trade name associated with one or more products made by the same company. A business marketing team will often spend considerable time developing effective ways of expressing the brand essence of their company's various brands by highlighting the unique benefits provided that pertain to the values of its target subculture." [businessdictionary.com/ definition/ brand-essence.html]
Brand essence model diagram visually display key points of brand essence in easy to understand form.
The example of wheel diagram (ring diagram, bevel style circle diagram) "Brand essence model" was created using the ConceptDraw PRO diagramming and vector drawing software extended with the Target and Circular Diagrams solution from the Marketing area of ConceptDraw Solution Park.
www.conceptdraw.com/ solution-park/ marketing-target-and-circular-diagrams
Wheel diagram

Circle Diagrams

Circular Arrows

3 Circle Venn. Venn Diagram Example

This wheel diagram sample was created on the base of figure illustrating the webpage "Chapter 3: Current State of the Ecosystem" of the website of the National Broadband Plan of US Federal Communications Comission (FCC). "The broadband ecosystem includes applications and content: e-mail, search, news, maps, sales and marketing applications used by businesses, user-generated video and hundreds of thousands of more specialized uses. Ultimately, the value of broadband is realized when it delivers useful applications and content to end-users.
Applications run on devices that attach to the network and allow users to communicate: computers, smartphones, set-top boxes, e-book readers, sensors, private branch exchanges (PBX), local area network routers, modems and an ever-growing list of other devices. New devices mean new opportunities for applications and content.
Finally, broadband networks can take multiple forms: wired or wireless, fixed or mobile, terrestrial or satellite. Different types of networks have different capabilities, benefits and costs.
The value of being connected to the network increases as more people and businesses choose to adopt broadband and use applications and devices that the network supports. Several factors contribute to their decisions. These include whether they can afford a connection, whether they are comfortable with digital technology and whether they believe broadband is useful.
Networks, devices and applications drive each other in a virtuous cycle. If networks are fast, reliable and widely available, companies produce more powerful, more capable devices to connect to those networks. These devices, in turn, encourage innovators and entrepreneurs to develop exciting applications and content. These new applications draw interest among end-users, bring new users online and increase use among those who already subscribe to broadband services. This growth in the broadband ecosystem reinforces the cycle, encouraging service providers to boost the speed, functionality and reach of their networks."
[broadband.gov/ plan/ 3-current-state-of-the-ecosystem/ ]
The circle pie chart example "Forces shaping the broadband ecosystem in the US" was created using the ConceptDraw PRO diagramming and vector drawing software extended with the Target and Circular Diagrams solution from the Marketing area of ConceptDraw Solution Park.
www.conceptdraw.com/ solution-park/ marketing-target-and-circular-diagrams
Wheel diagram

HelpDesk
How to Draw a Pie Chart

HelpDesk
How to Create Marketing Infographics

- Marketing mix - Wheel diagram | Target diagrams - Vector stencils ...
- Marketing Environment Diagram Chart
- Marketing plan - Circular diagram | Marketing Analysis Diagram ...
- Target and Circular Diagrams | Marketing Diagrams | Marketing mix ...
- Target market - Onion diagram | Target market | Target and Circular ...
- Marketing Pie Chart
- Marketing Analysis Diagram | Flowchart Example: Flow Chart of ...
- Competitor Analysis | Pie Donut Chart . Pie Chart Examples | Pie ...
- Target and Circular Diagrams | Circular Diagram | Content ...
- Competitor Analysis | Target Diagram | Target and Circular ...
- Pyramid Diagram and Pyramid Chart | Circle Spoke Diagram ...
- How To Create a Visio Circle -Spoke Diagram Using ConceptDraw ...
- Target Diagram | Target and Circular Diagrams | Target market ...
- Marketing Charts | Marketing Flow Chart | Best Diagramming ...
- Circle -spoke diagram - Target market | Target Diagram | Circular ...
- Schedule pie chart - Daily action plan | How to Draw a Pie Chart ...
- How to Draw a Circular Arrows Diagram Using ConceptDraw PRO ...
- How to Draw the Different Types of Pie Charts | Pie Chart Examples ...
- Virtuous circle (management) - Ring chart | Circular Diagram ...