Helpful in all stages of quality management

Marketing Sales Funnel Examples

 Funnel Diagrams
Funnel Diagrams solution including wide range of funnel diagram samples, sales funnel examples, and vector design elements, makes the ConceptDraw DIAGRAM ideal for funnel management and creation the Funnel Diagrams of different types and designs, AIDA Model, AIDAS, ACCA Dagmar, Rossiter-Percy Model, Sales funnel, Marketing funnel, Search funnel, Brand funnel, Purchase funnel, Lead funnel, Conversion funnel, Business funnel, etc. You are free to choose to place your funnel object horizontally or vertically, you can use the objects with desired quantity of sales funnel stages, as well as to modify their size, color filling, and other parameters to make exceptionally looking Funnel diagrams fully responding to your desires.
Funnel Diagram

In order to make a funnel diagram, the Funnel Diagrams solution can be used while working in the ConceptDraw DIAGRAM diagramming and drawing software. Having the pre-made design elements as well as the examples of funnel diagrams, the Funnel Diagrams solution allows any ConceptDraw DIAGRAM user to make their own unique as well as professionally-looking drawings.
QFD | Quality Function Deployment Diagram

Marketing Analysis Diagram

Pyramid Diagram

How to Draw an Effective Flowchart

Marketing Research Project

Marketing Flow Chart

How to Create a Social Media DFD Flowchart

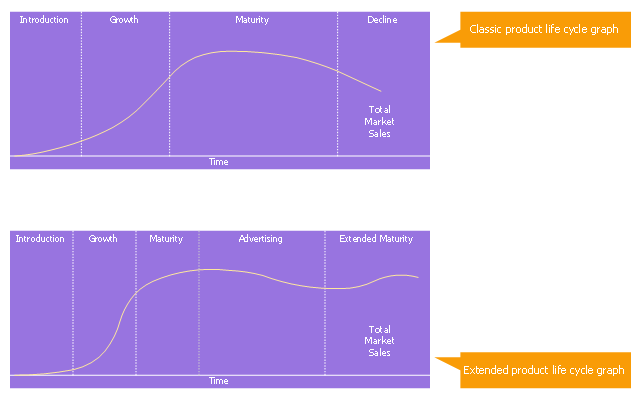
This is product lifecycle graph (PLC) diagram template.
Use it to design your product lifecycle graphs with ConceptDraw PRO software.
PLC graph visualizes a new product progress through a sequence of stages from introduction to Growth, Maturity, and Decline. This sequence is associated with changes in the marketing situation, thus impacting the marketing strategy and the marketing mix. The product revenue and profits can also be plotted as a function of the PLC stages.
The marketing chart template "Product life cycle graph" is included in the Marketing Diagrams solution from the Marketing area of ConceptDraw Solution Park.
Marketing graph template
Business Productivity - Marketing

Online Marketing Objectives

Pyramid Diagram and Pyramid Chart

Process Flow app for macOS

What is SWOT Analysis?

Sales Dashboards for Your Company

Samples of Flowchart

UML Diagram Visio

- Product life cycle process - Flowchart | Stages In Marketing Process
- Flowchart Marketing Process. Flowchart Examples | Sales Process ...
- Product Life Cycle Diagram Marketing
- Product life cycle process - Flowchart | Circular Arrows Diagrams ...
- Flowchart - Product life cycle process
- Circular Diagram | Target and Circular Diagrams | Marketing ...
- Product life cycle graph
- Product life cycle process - Flowchart | Marketing diagrams - Vector ...
- Product life cycle graph
- Product life cycle graph | Changes In The Marketing Situation
- Stages of personnel certification - Cross-functional flowchart ...
- Gantt chart examples | Online Marketing Objectives | Gant Chart in ...
- Flowchart Marketing Process. Flowchart Examples | Marketing Flow ...
- Marketing Charts | Marketing Flow Chart | Best Diagramming ...
- HVAC Marketing Plan | Flowchart Example: Flow Chart of Marketing ...
- Flowchart Example: Flow Chart of Marketing Analysis | Flowchart ...
- Product life cycle graph
- Marketing Flow Chart | Flowchart Marketing Process. Flowchart ...
- Marketing Analysis Diagram | Flowchart Example: Flow Chart of ...