QFD | Quality Function Deployment Diagram
A product development process is always an essential part of any quality function deployment (QFD) process, consisting of a few activities that are known for firms to employ in the complex processes of delivering some new products to their market. It is a well-known and widely used process management approach that can help provide a structure.
Product development is known to be often overlapping with the needed engineering design process. In particular, it happens when the new product is being developed, involving the applications of math or/and science. Every new product is known to be passing through some series of stages (or phases), such as ideation among other many other aspects of any process of designing.
Manufacturing, as well as a market introduction, are the stages that most of the products go through. There are also the so-called highly complex engineered products, such as aircrafts, machinery, automotive, etc. For such products, the new product development process can be also complex depending on the management of personnel, the deliverables and milestones. The projects that involve developing and producing the previously mentioned complex products usually use the so-called “integrated product team approach”.
The process that involves managing some large sale complex engineering products is usually much slower than those which involve managing many ordinary types of consumer goods. The product development process as a part of the quality function deployment (QFD) should be broken down and articulated in many different ways, many of which include such stages as the so-called “fuzzy front-end” which is simply the set of different activities that can be employed before the well-defined and the more formal requirements specifications are completed.
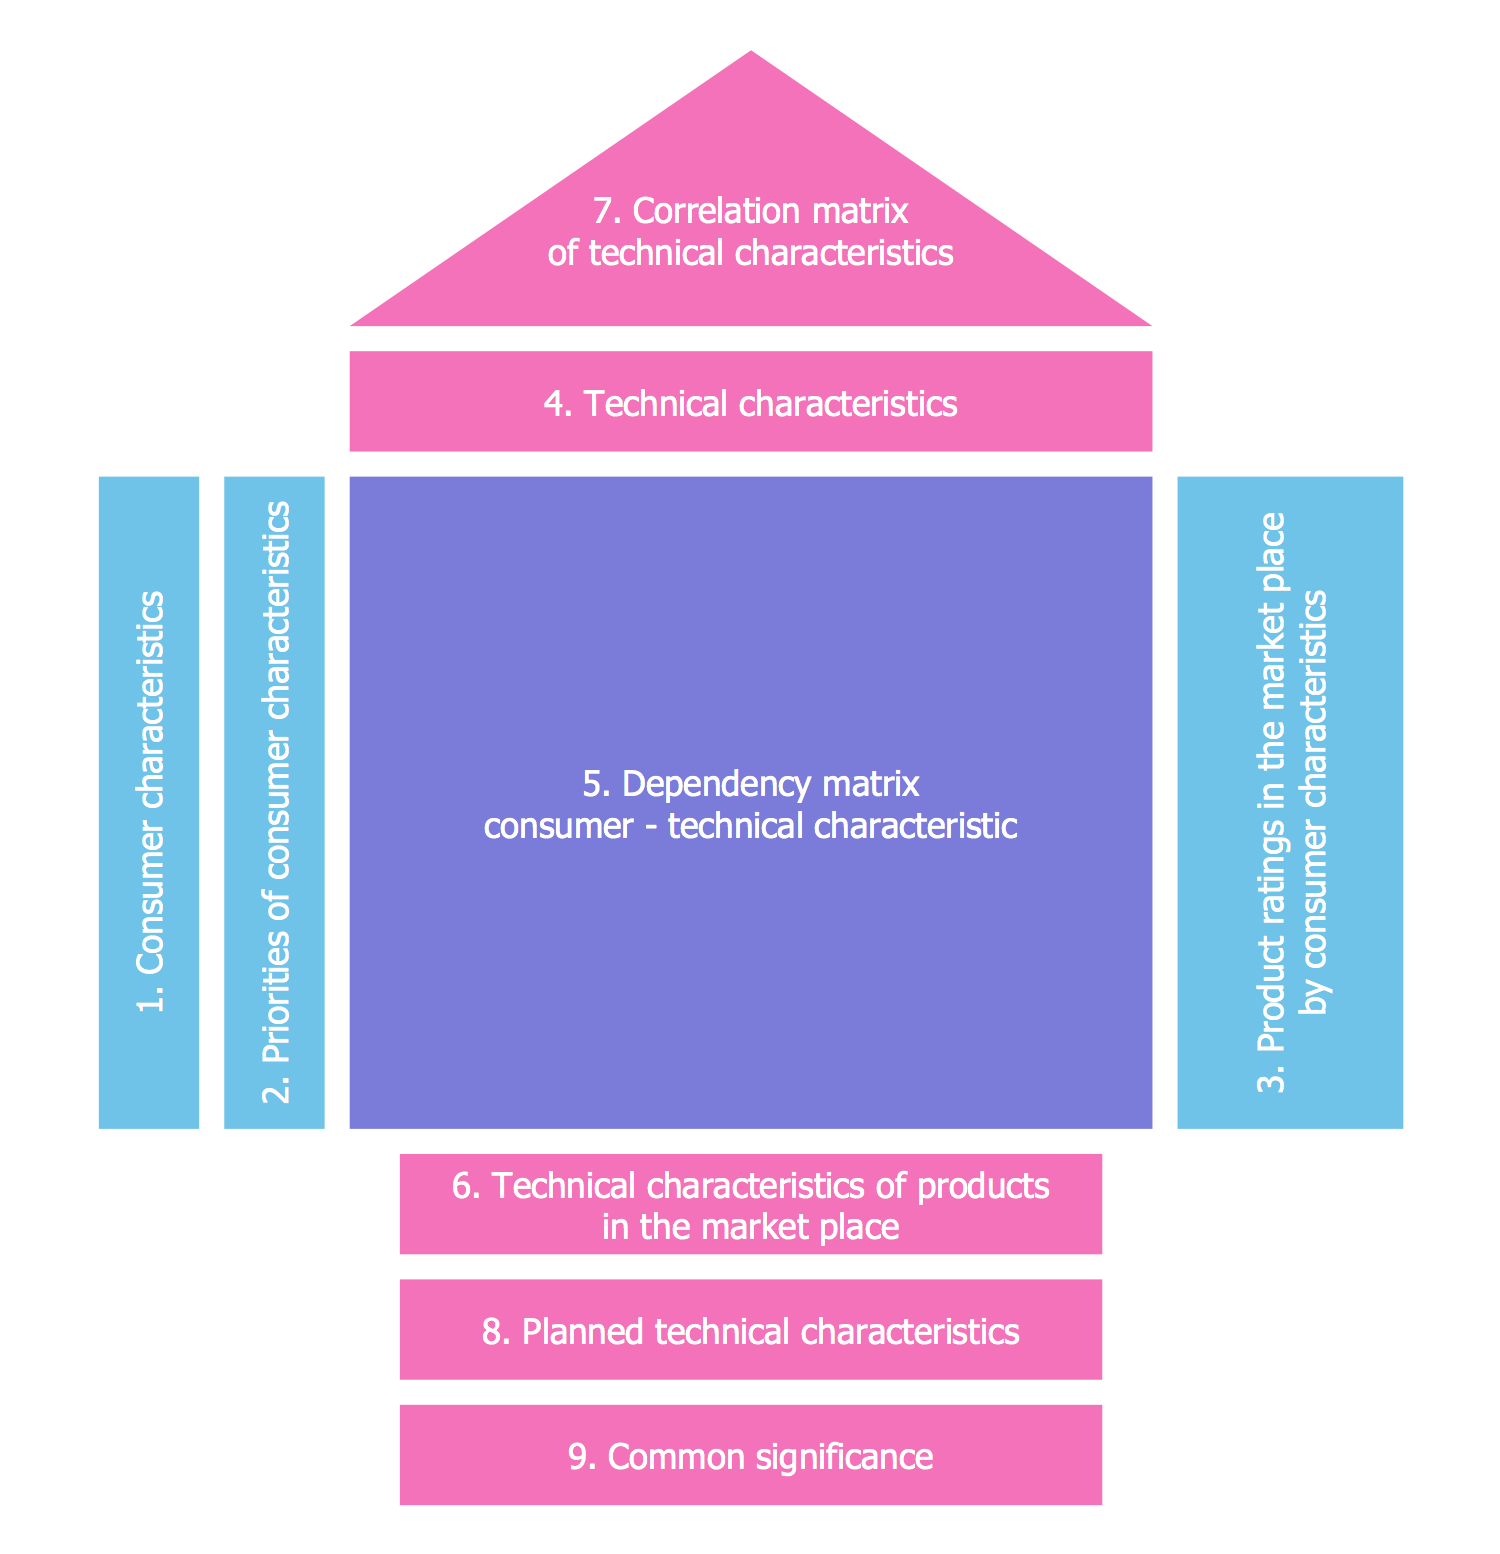
Pic. 1. House of Quality QFD Scheme
The mentioned requirements speak to what the product should have or do at different degrees of specificity so it can meet the perceived business or market need. Any product design is simply the development of both the detailed-level and the high-level design of the product which turns the “what” of the requirements into some specific “how” this particular product can meet the needed requirements.
The previously described process is known for overlapping with the engineering design process, but it can also include the so-called industrial design and other aspects of design. On the planning and marketing side, the mentioned phase ends at the pre-commercialization analysis stage.
The so-called product implementation phase can be referred to the later stages of the detailed engineering design, same as the test process that can be used for validating that the prototype meets all the needed design specifications that were previously established.
The commercialization or the fuzzy back-end phase is known for representing all the needed action steps where both the market launch and the production occur. Such front-end marketing stages have been so far very well researched and the valuable models were proposed. Thus, a five-step front-end activity was proposed, being called as the “front-end innovation” including the opportunities identification, opportunities analysis, ideas genesis, ideas selection, and both ideas and technologies development.
The front end of any innovation is known to be the greatest area of weakness in any NPD process that is known to be a part of the QFD. Engineering design is simply the process during which some technical solution can be developed in order to solve some given problem. This design stage is always treated as a very important one because at this phase most of the product lifecycle costs can be and should be engaged.
Most of the final product quality, as well as product entire life-cycle costs, can be determined on the product design stage. At the same time, the design-manufacturing interface can represent the greatest opportunity for any needed cost reduction. All the design projects can last from only a few weeks to a few years, but usually for one year. Both Commercialization and Design phases start a very early collaboration.
When the concept design is finished, it can be after sent to the appropriate manufacturing plant for developing the needed Concurrent Engineering approach by implementing different practices such as DFM/DFA, QFD and other. Any output of the design is simply a set of both process and product specifications. It is usually done in the form of drawings and such drawings can be always made with the help of the ConceptDraw DIAGRAM diagramming and drawing software by using another relatively new product of CS Odessa — the ConceptDraw STORE application.
Having both mentioned tools anyone can make all the needed thematic drawings, such as the QFD diagrams and other HOQ ones, such as the HOQ matrices. Having the House of Quality solution downloaded from the ConceptDraw STORE application means having all the needed tools for creating the House of Quality drawings either using the design elements from one of two stencil libraries, such as a “House of Quality Symbols” one, or by having the pre-made templates as the drafts for creating the unique matrices and diagrams.

Pic. 1. Quality Function Deployment QFD Diagrams
The output of the house of quality can be a matrix that can be created with the help of both ConceptDraw DIAGRAM and ConceptDraw STORE applications. Both of them can be always downloaded from this site and used for creating the HOQ diagrams and HOQ matrices. Having the House of Quality solution from the ConceptDraw STORE application might result in great looking drawings as it offers two stencil libraries to use the design elements from.
Thus, having such design symbols which represent different actions and shapes such as Plus, Plus contour, Circled plus, Minus, Minus contour, Circled minus, Circled X cross, Square contour, Square, Arrow up, Arrow up contour, Arrow down, Arrow down contour, Circle contour, Circle, Circled dot, Ellipse, Triangle up contour, Triangle up, Triangle down contour, Triangle down, Diamond, Diamond contour, Star contour, Star, Sharp, Tick, Tick contour, Asterisk 5 points, Asterisk 6 points and others, may help any ConceptDraw DIAGRAM user create the needed drawing within a short period of time getting a great looking result as well as a professionally looking one.