The vector stencils library "TQM diagrams" contains 58 TQM symbols. Use it in business process re-engineering, total quality management, continuous improvement, and quality solutions to draw cause-and-effect diagrams, top-down, and cross-functional process flow charts in the ConceptDraw PRO diagramming and vector drawing software extended with the Total Quality Management (TQM) Diagrams solution from the Quality area of ConceptDraw Solution Park.
Transportation
Inbound Goods
Storage
Procedure

Operation

Operation/ Inspection
Issue

Organization Function
2-Part Function

Decision 1 (TQM)
-tqm-diagrams---vector-stencils-library.png--diagram-flowchart-example.png)
Decision 2 (TQM)
-tqm-diagrams---vector-stencils-library.png--diagram-flowchart-example.png)
Multi in/out Decision (Multi-Input on right)
-tqm-diagrams---vector-stencils-library.png--diagram-flowchart-example.png)
Multi in/out Decision (Multi-Input on left)
-tqm-diagrams---vector-stencils-library.png--diagram-flowchart-example.png)
External Organization

External Process

Inspection/Measurement

Metric

2-part metric

System Database
System Support

System Function

Delay
Connector (TQM)
-tqm-diagrams---vector-stencils-library.png--diagram-flowchart-example.png)
Off-Page Reference

Connected Issues

Fabrication (black)
-tqm-diagrams---vector-stencils-library.png--diagram-flowchart-example.png)
Fabrication (white)
-tqm-diagrams---vector-stencils-library.png--diagram-flowchart-example.png)
Move (black)
-tqm-diagrams---vector-stencils-library.png--diagram-flowchart-example.png)
Move (white)
-tqm-diagrams---vector-stencils-library.png--diagram-flowchart-example.png)
Store (black)
-tqm-diagrams---vector-stencils-library.png--diagram-flowchart-example.png)
Store (white)
-tqm-diagrams---vector-stencils-library.png--diagram-flowchart-example.png)
Inspection (black)
-tqm-diagrams---vector-stencils-library.png--diagram-flowchart-example.png)
Inspection (white)
-tqm-diagrams---vector-stencils-library.png--diagram-flowchart-example.png)
Selectable Process (All White)
-tqm-diagrams---vector-stencils-library.png--diagram-flowchart-example.png)
Selectable Process ('Fabrication' Black)
-tqm-diagrams---vector-stencils-library.png--diagram-flowchart-example.png)
Selectable Process ('Move' Black)
-tqm-diagrams---vector-stencils-library.png--diagram-flowchart-example.png)
Selectable Process ('Store' Black)
-tqm-diagrams---vector-stencils-library.png--diagram-flowchart-example.png)
Selectable Process ('Inspection' Black)
-tqm-diagrams---vector-stencils-library.png--diagram-flowchart-example.png)
Work Flow Loop 1
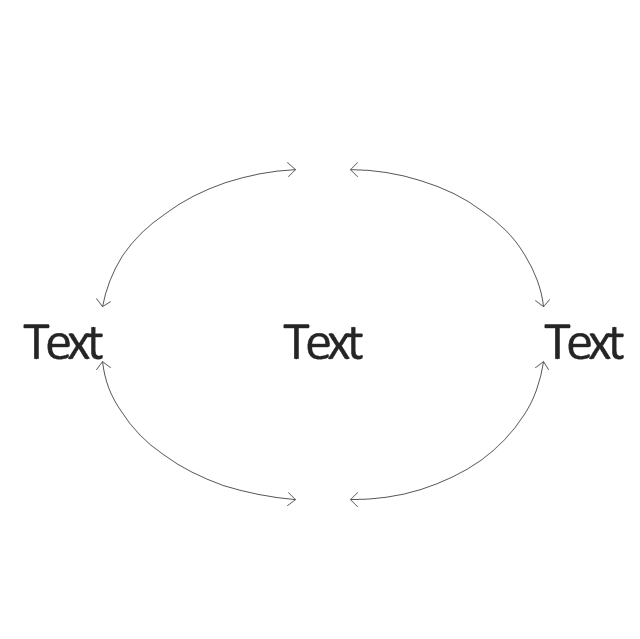
Work Flow Loop 2
Feedback Arrow
X-Function - Vertical

X-Function - Horizontal

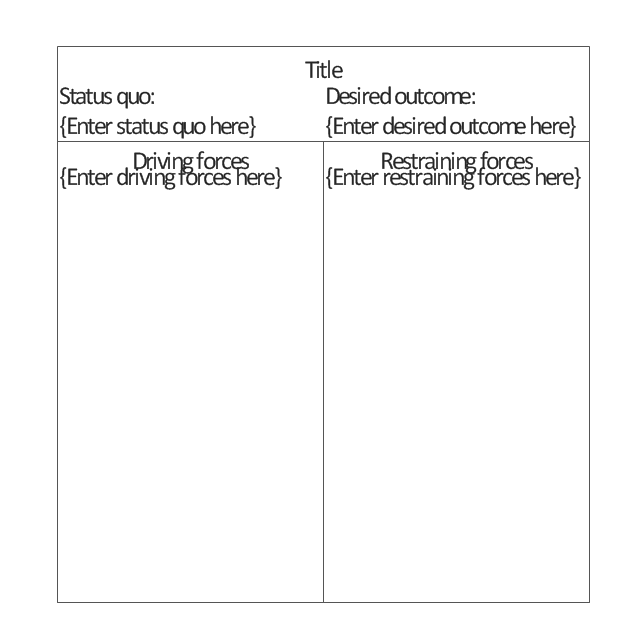
Force-Field Analysis
Cause 1
Cause 2
Cause 3
Category
Effect
Fish Frame

Dynamic Connector
Result
No Result

Branch: Return

Branch: No Return

Interrupt

External Control

Refinement

Process Flowchart


 Event-driven Process Chain Diagrams
Event-driven Process Chain (EPC) Diagram is a type of flowchart widely used for modeling in business engineering and reengineering, business process improvement, and analysis. EPC method was developed within the Architecture of Integrated Information Systems (ARIS) framework.
How Do Fishbone Diagrams Solve Manufacturing Problems

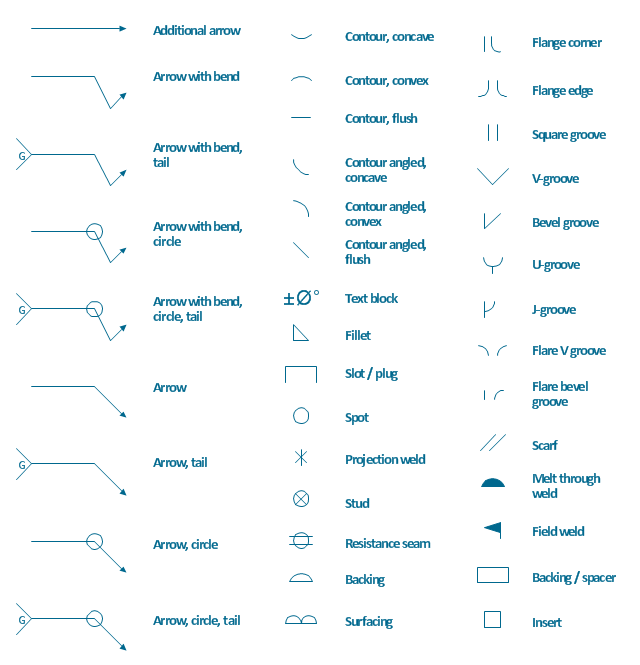
The vector stencils library "Welding" contains 38 welding joint symbols to identify fillets, contours, resistance seams, grooves, surfacing, and backing.
Use it to indicate welding operations on working drawings.
"Welding is a fabrication or sculptural process that joins materials, usually metals or thermoplastics, by causing coalescence. This is often done by melting the workpieces and adding a filler material to form a pool of molten material (the weld pool) that cools to become a strong joint, with pressure sometimes used in conjunction with heat, or by itself, to produce the weld. This is in contrast with soldering and brazing, which involve melting a lower-melting-point material between the workpieces to form a bond between them, without melting the workpieces.
Many different energy sources can be used for welding, including a gas flame, an electric arc, a laser, an electron beam, friction, and ultrasound.
Welds can be geometrically prepared in many different ways. The five basic types of weld joints are the butt joint, lap joint, corner joint, edge joint, and T-joint (a variant of this last is the cruciform joint). Other variations exist as well - for example, double-V preparation joints are characterized by the two pieces of material each tapering to a single center point at one-half their height. Single-U and double-U preparation joints are also fairly common - instead of having straight edges like the single-V and double-V preparation joints, they are curved, forming the shape of a U. Lap joints are also commonly more than two pieces thick - depending on the process used and the thickness of the material, many pieces can be welded together in a lap joint geometry." [Welding. Wikipedia]
The shapes example "Design elements - Welding" was created using the ConceptDraw PRO diagramming and vector drawing software extended with the Mechanical Engineering solution from the Engineering area of ConceptDraw Solution Park.
Welding joint symbols
Data Flow Diagram Model

Bar Diagrams for Problem Solving. Create manufacturing and economics bar charts with Bar Graphs Solution

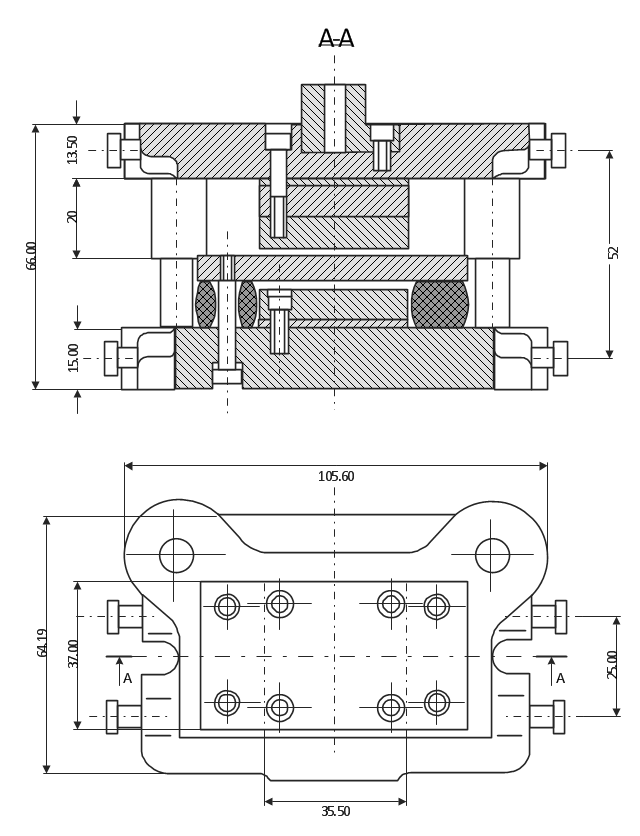
This technical drawing shows the machine parts assembly using joining by threaded fasteners.
"Assembling (joining of the pieces) is done by welding, binding with adhesives, riveting, threaded fasteners, or even yet more bending in the form of a crimped seam. Structural steel and sheet metal are the usual starting materials for fabrication, along with the welding wire, flux, and fasteners that will join the cut pieces. As with other manufacturing processes, both human labor and automation are commonly used. The product resulting from fabrication may be called a fabrication. Shops that specialize in this type of metal work are called fab shops. The end products of other common types of metalworking, such as machining, metal stamping, forging, and casting, may be similar in shape and function, but those processes are not classified as fabrication." [Metal fabrication. Wikipedia]
This mechanical engineering drawing example was designed using ConceptDraw PRO diagramming and vector drawing software extended with Mechanical Engineering solution from Engineering area of ConceptDraw Solution Park.
Material Requisition Flowchart. Flowchart Examples

The Sales Process

Sales Process Map

Types of Welding in Flowchart

Symboles Organigramme

Types of Flowchart - Overview


Cross Functional Flowchart Examples

- Fabrication Process Flow Chart
- Process Flowchart | Material Requisition Flowchart. Flowchart ...
- Technical drawing - Machine parts assembling | Process Flowchart ...
- Process Flowchart | Machining Symbols For Fabrication
- Process Flowchart | Fabrication And Machining Symbol
- Flow Chart Of Fabrication Process
- What is Value Stream Mapping? | 4m Analysis In Fabrication Process
- Process Flowchart | Technical drawing - Machine parts assembling ...
- Process Flowchart | Technical drawing - Machine parts assembling ...
- Process Flowchart | Electrical Symbols — Transistors | Design ...
- Process Flowchart | Fabrication Flow Process Design In Word
- Process Flowchart | Design elements - Welding | Electrical Symbols ...
- Process Flowchart | Steel Fabrication Drafting Symbols
- Process Flowchart | With A Diagram State The Chassis Fabrication ...
- Flow Process Chart For Fabrication Of Pressure Vessel
- Process Flowchart | TQM diagrams - Vector stencils library | Types of ...
- Process Flowchart | Types of Flowchart - Overview | Total Quality ...
- Process Flowchart | Machining Symbol Fabrication Symbols
- Process Flowchart | Event-driven Process Chain Diagrams | Pipe ...