Process Flowchart
ConceptDraw is Professional business process mapping software for making process flow diagram, workflow diagram, general flowcharts and technical illustrations for business documents. It is includes rich examples, templates, process flowchart symbols. ConceptDraw flowchart maker allows you to easier create a process flowchart. Use a variety of drawing tools, smart connectors, flowchart symbols and shape libraries to create flowcharts of complex processes, process flow diagrams, procedures and information exchange.
Basic Flowchart Symbols and Meaning
Flowchart Symbols and Meaning - Provides a visual representation of basic flowchart symbols and their proposed use in professional workflow diagram, standard process flow diagram and communicating the structure of a well-developed web site, as well as their correlation in developing on-line instructional projects. See flowchart's symbols by specifics of process flow diagram symbols and workflow diagram symbols.
Data Flow Diagram Symbols. DFD Library
Data Flow Diagrams show information transfers and process steps of a system. The general concept is an approach of a depicting how occurs input in a system, further processes and what runs out. The aim of DFD is in accomplishing of understanding between developers and users. Data flow diagrams are maintained with other methods of structured systems analysis.Gane Sarson Diagram
The vector stencils library Gane-Sarson Notation from the solution Data Flow Diagrams contains specific symbols of the Gane-Sarson notation such as process symbol, connector symbol, jump symbol for ConceptDraw DIAGRAM diagramming and vector drawing software. The Data Flow Diagrams solution is contained in the Software Development area of ConceptDraw Solution Park.Pyramid Diagram
The DIKW Pyramid refers loosely to a class of models for representing purported structural and/or functional relationships between data, information, knowledge, and wisdom.Business Process Modeling Notation
ConceptDraw DIAGRAM is a software for simplу depicting the business processes based on BPMN 2.0.Business Process Diagrams Cross-Functional-Flowcharts, Workflows, Process Charts, IDEF0 and IDEF2, Timeline, Calendars, Gantt Charts, Business Process Modeling, Audit and Opportunity Flowcharts and Mind Maps (presentations, meeting agendas).
How To Draw a Diagram
Is it possible to draw a diagram as quickly as the ideas come to you? The innovative ConceptDraw Arrows10 Technology included in ConceptDraw DIAGRAM is a simple and powerful tool to create any type of diagram.You mau choose to start from one of plenty diagram templates or to use your own idea.
Booch OOD Diagram
The vector stencils library Booch OOD from the solution Software Engineering contains specific symbols of the Booch method such as class symbols, association symbols, aggregation symbols for ConceptDraw DIAGRAM diagramming and vector drawing software. The Software Engineering solution is contained in the Software Development area of ConceptDraw Solution Park.Local area network (LAN). Computer and Network Examples
A local area network (LAN) is a devices network that connect with each other in the scope of a home, school, laboratory, or office. Usually, a LAN comprise computers and peripheral devices linked to a local domain server. All network appliances can use a shared printers or disk storage. A local area network serve for many hundreds of users. Typically, LAN includes many wires and cables that demand a previously designed network diagram. They are used by IT professionals to visually document the LANs physical structure and arrangement.ConceptDraw - Perfect Network Diagramming Software with examples of LAN Diagrams. ConceptDraw Network Diagram is ideal for network engineers and network designers who need to draw Local Area Network diagrams.

Tree Network Topology Diagram
The Tree Network Topology Diagram examples was created using ConceptDraw DIAGRAM software with Computer and Networks solution.Create Flow Chart on Mac
Use ConceptDraw DIAGRAM diagramming and business graphics software to draw your own flowcharts of business processes. Start creating your own Process Flow Diagram with ConceptDraw DIAGRAM and accomplish great results in the moment.Extended flowchart maker features of Rapid Draw functionality was developed to create flow chart on the Mac OS X platform. You will save time by quick and simple flowchart maker due to Rapid Draw.
Internal Audit Process
Internal auditing is an independent, objective assurance and consulting activity designed to add value and improve an organization's operations.ConceptDraw DIAGRAM diagramming and vector drawing software extended with Audit Flowcharts solution from the Finance and Accounting area perfectly suits for the Internal Audit Process. You can make sure this right now!
Expand collaboration capabilities with ConceptDraw DIAGRAM
Internet solutions on ConceptDraw base. What may interest developers of Internet solutions.
 Data Flow Diagrams (DFD)
Data Flow Diagrams solution extends ConceptDraw DIAGRAM software with templates, samples and libraries of vector stencils for drawing the data flow diagrams (DFD).
 Business Process Mapping
The Business Process Mapping solution for ConceptDraw DIAGRAM is for users involved in process mapping and creating SIPOC diagrams.
UML Tool & UML Diagram Examples
The classical design of any automated process is UML diagrams that provide wide graphical ways to present all aspects of automation.Solution RapidUML from Software Development area of ConceptDraw Solution Park provides templates, examples and 13 vector stencils libraries for drawing all types of UML 1.x and 2.x diagrams using ConceptDraw DIAGRAM diagramming and vector drawing software.
Use these UML diagram templates and examples to quickly start drawing your own UML diagrams.
Information Architecture
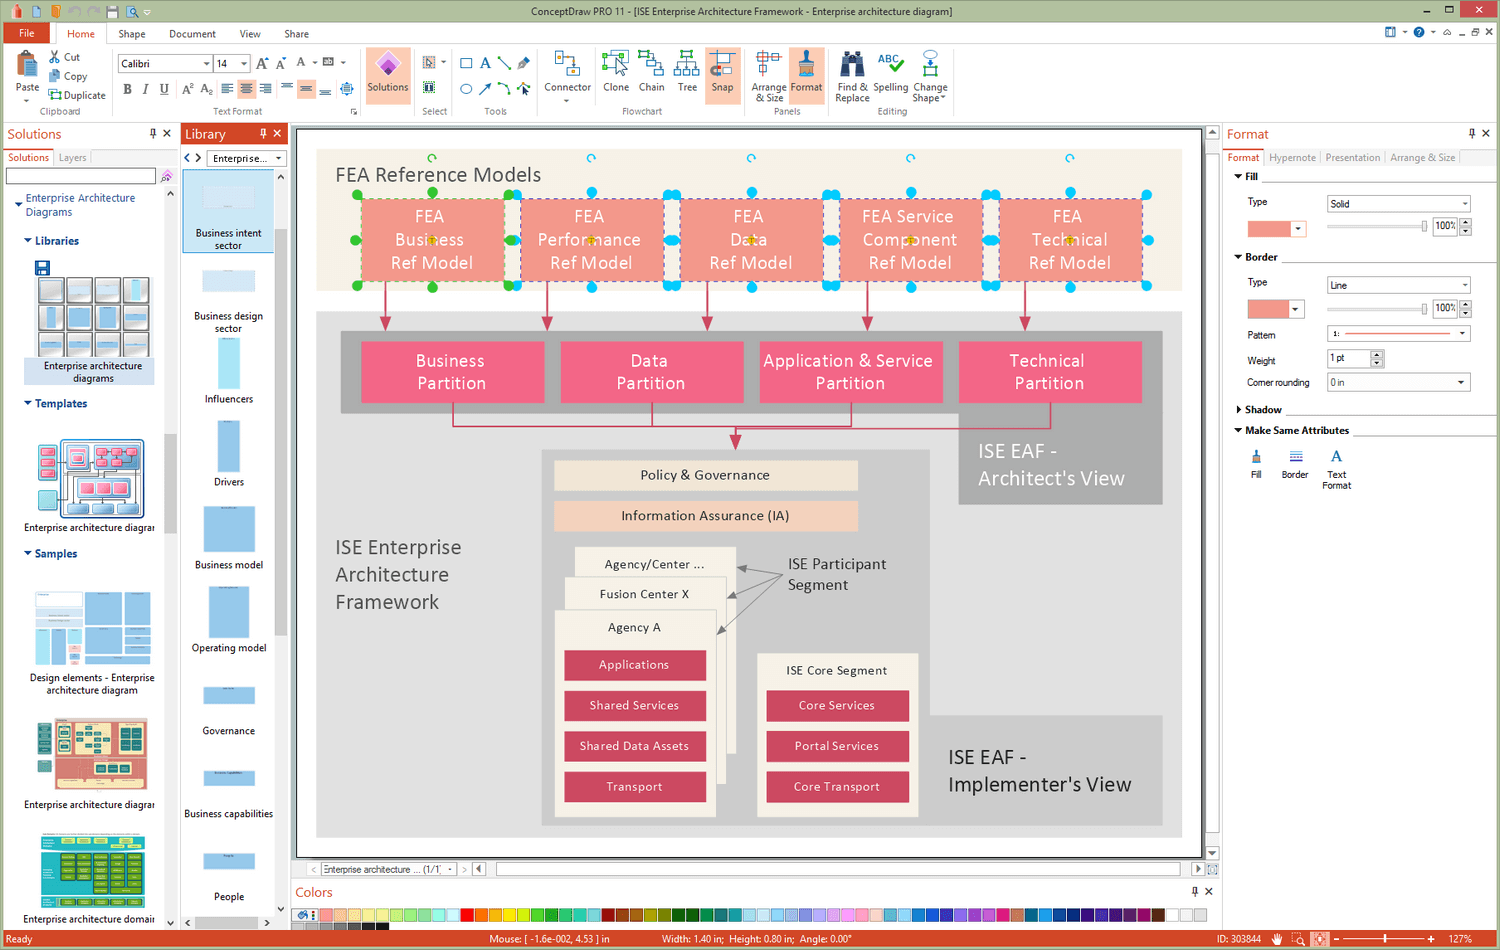
You want design the Information Architecture and need a powerful software for this? ConceptDraw DIAGRAM extended with Enterprise Architecture Diagrams Solution from the Management Area is exactly what you need.Pyramid Diagram
A three level pyramid model of different types of Information Systems based on the type of decisions taken at different levels in the organization.How Do Fishbone Diagrams Solve Manufacturing Problems
How do Fishbone diagrams solve manufacturing problems? Fishbone diagrams are successfully used in various fields of industries and manufacturing to analyze the set of possible causes and their effects. Fishbone diagram provides a process to clearly define the “Effect” and then puts you to thinking about the possible causes, based on the categories of common problems in manufacturing.ConceptDraw DIAGRAM application extended with Fishbone Diagrams solution lets you construct Fishbone diagrams and represent globally recognized standards for manufacturing 6 Ms and 8 Ms.
Software development with ConceptDraw DIAGRAM
ConceptDraw possesses powerful tools for designing of technical documentation for object-oriented projects. The libraries included in the package allow to easily draw class hierarchies, object hierarchies and diagrams of data flows with the use of the most popular notations, including UML and Booch notations.- Water cycle diagram | Drawing a Nature Scene | Draw Flowcharts ...
- Water cycle diagram | Drawing a Nature Scene | Drawing Illustration ...
- Circular Diagram
- Atmosphere air composition | Percentage Pie Chart. Pie Chart ...
- 5 Level pyramid model diagram - Information systems types | 4 Level ...
- Water cycle diagram | Drawing Illustration | Beauty in nature ...
- Water cycle diagram | Strategic planning - Cycle diagram | Drawing ...
- Water cycle diagram | Strategic planning - Cycle diagram | Research ...
- Water cycle diagram | BPR Diagram . Business Process ...
- Water cycle diagram | Drawing a Nature Scene | Drawing Illustration ...
- Water cycle diagram | Drawing a Nature Scene | Drawing Illustration ...
- Audit Flowchart Symbols | Accounting Flowchart Symbols | Basic ...
- Design elements - Marketing charts | Scatter Chart Examples ...
- Water cycle diagram | Drawing Illustration | Drawing a Nature Scene ...
- Water cycle diagram | Drawing Illustration | Beauty in nature ...
- Water cycle diagram | | Fishbone Diagrams | Cloud Water Flow ...
- With The Aid Of Diagram Explain Information Technology
- Network Layout Floor Plans | Network Layout | Computer Network ...
- Water cycle diagram | Drawing a Nature Scene | Diagram Of H20 ...
- Draw A Block Daigram For A Organization
- ERD | Entity Relationship Diagrams, ERD Software for Mac and Win
- Flowchart | Basic Flowchart Symbols and Meaning
- Flowchart | Flowchart Design - Symbols, Shapes, Stencils and Icons
- Flowchart | Flow Chart Symbols
- Electrical | Electrical Drawing - Wiring and Circuits Schematics
- Flowchart | Common Flowchart Symbols
- Flowchart | Common Flowchart Symbols


