Percentage Pie Chart. Pie Chart Examples

This pie chart sample shows the atmosphere air composition. It was designed on the base of the Wikimedia Commons file: Air composition pie chart.JPG.
[commons.wikimedia.org/ wiki/ File:Air_ composition_ pie_ chart.JPG]
This file is licensed under the Creative Commons Attribution-Share Alike 3.0 Unported license. [creativecommons.org/ licenses/ by-sa/ 3.0/ deed.en]
"The atmosphere of Earth is a layer of gases surrounding the planet Earth that is retained by Earth's gravity. The atmosphere protects life on Earth by absorbing ultraviolet solar radiation, warming the surface through heat retention (greenhouse effect), and reducing temperature extremes between day and night (the diurnal temperature variation).
The common name given to the atmospheric gases used in breathing and photosynthesis is air. By volume, dry air contains 78.09% nitrogen, 20.95% oxygen, 0.93% argon, 0.039% carbon dioxide, and small amounts of other gases. Air also contains a variable amount of water vapor, on average around 1%. Although air content and atmospheric pressure vary at different layers, air suitable for the survival of terrestrial plants and terrestrial animals currently is only known to be found in Earth's troposphere and artificial atmospheres." [Atmosphere of Earth. Wikipedia]
The pie chart example "Atmosphere air composition" was created using the ConceptDraw PRO diagramming and vector drawing software extended with the Pie Charts solution of the Graphs and Charts area in ConceptDraw Solution Park.
Pie chart

EPC - Business Processes in Terms of Work Flows

How to Realize your Social Media Strategy

Sales Dashboards for Your Company

Data Visualization Solutions

Example of Organizational Chart


What is Gantt Chart (historical reference)
 *")
Business Process Reengineering Examples

Column Chart Template

Entity-Relationship Diagram (ERD) with ConceptDraw DIAGRAM
 <br>with ConceptDraw DIAGRAM *")

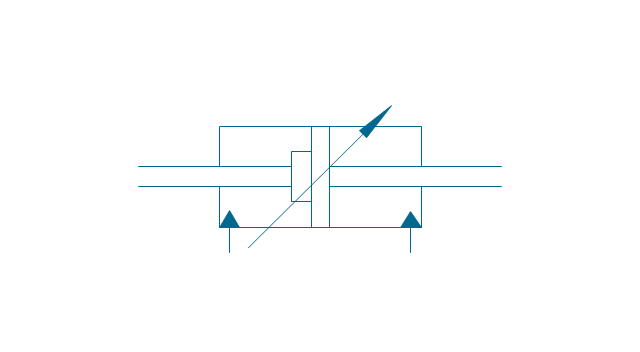
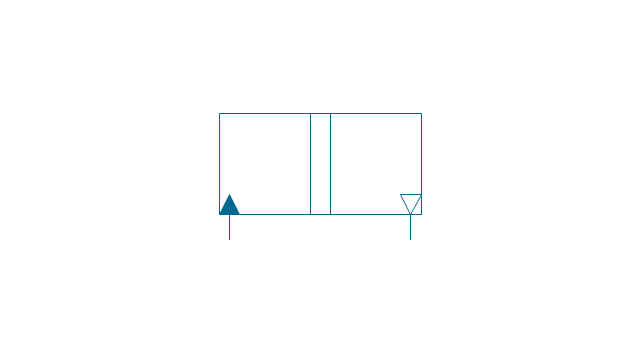
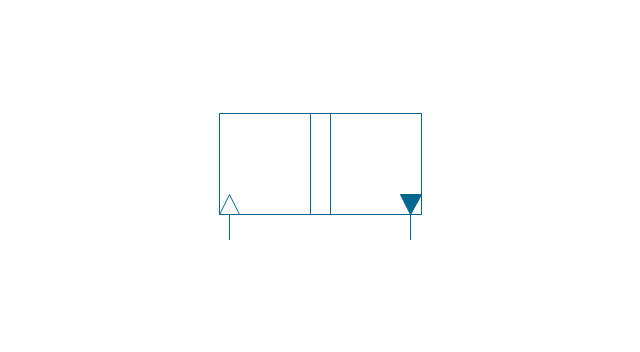
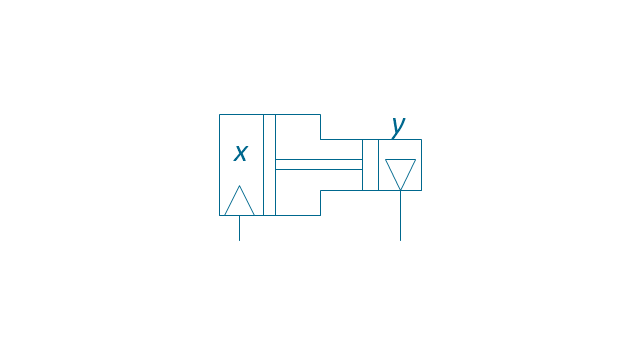
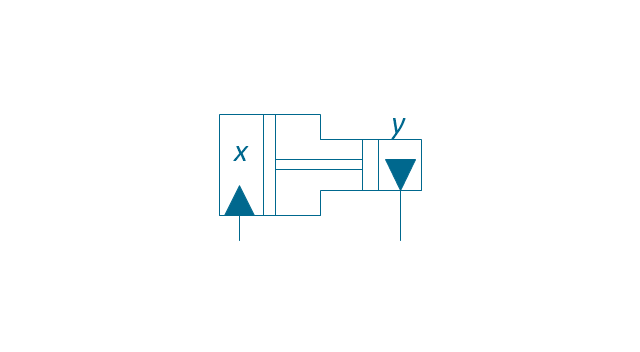
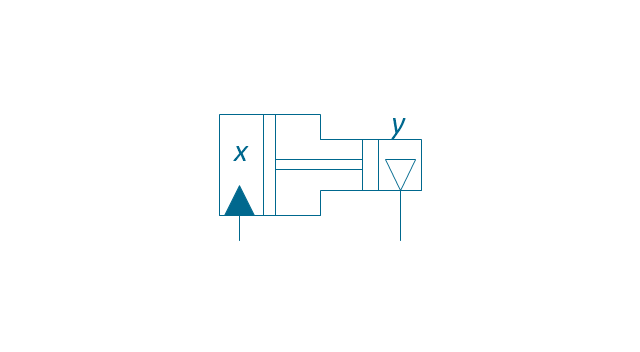
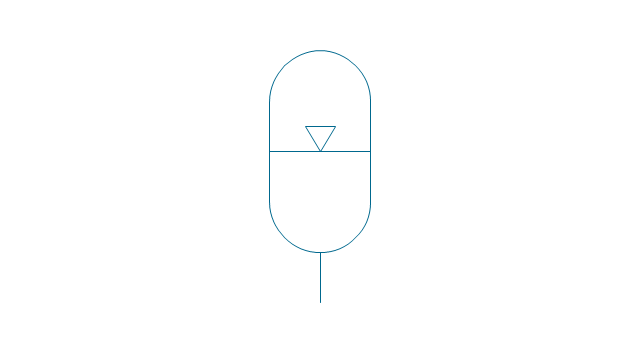
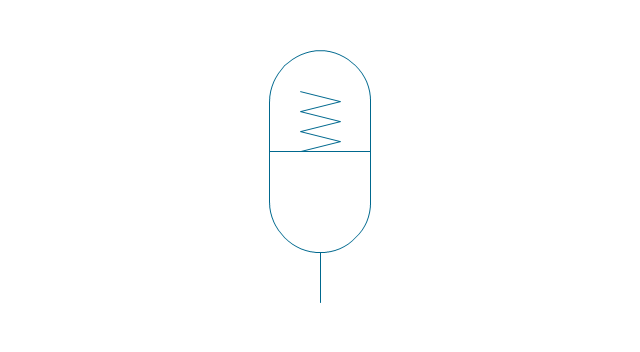
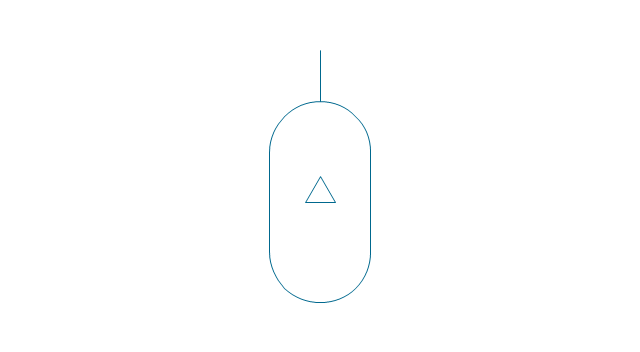
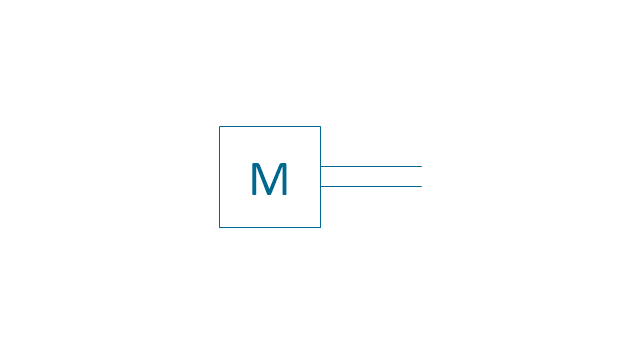
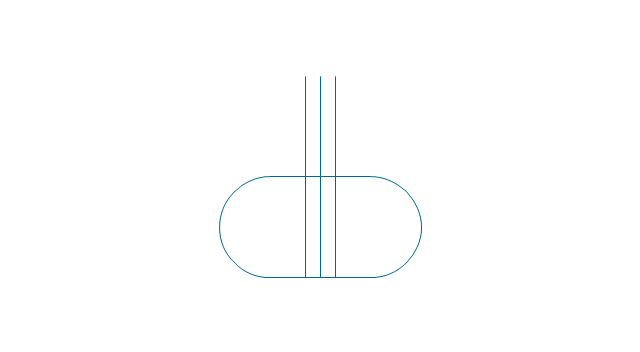
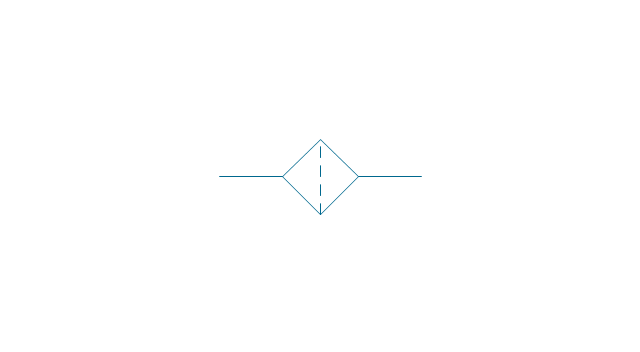
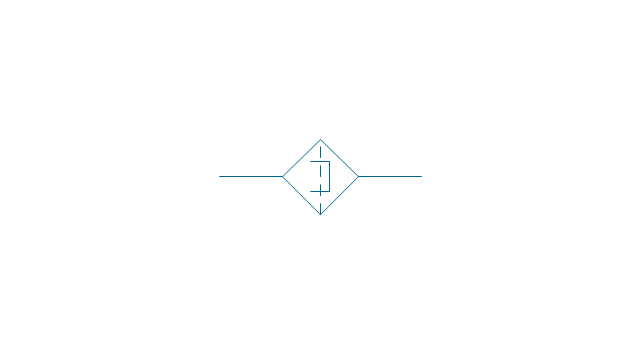
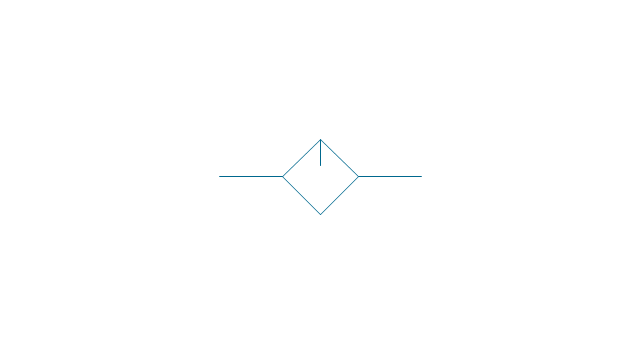
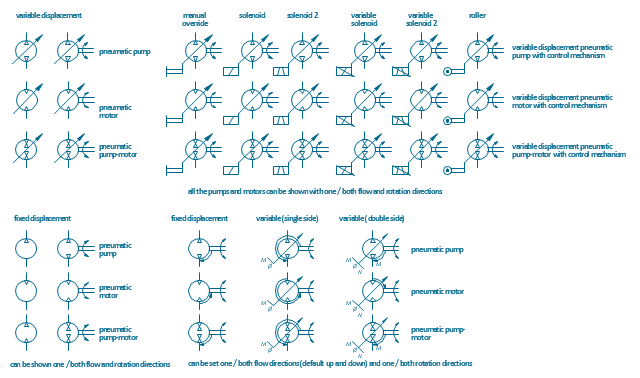
The vector stencils library "Fluid power equipment" contains 113 symbols of hydraulic and pneumatic equipment including pumps, motors, air compressors, cylinders, meters, gauges, and actuators. Use it to design fluid power and hydraulic control systems.
"Fluid power is the use of fluids under pressure to generate, control, and transmit power. Fluid power is subdivided into hydraulics using a liquid such as mineral oil or water, and pneumatics using a gas such as air or other gases. Compressed-air and water-pressure systems were once used to transmit power from a central source to industrial users over extended geographic areas; fluid power systems today are usually within a single building or mobile machine." [Fluid power. Wikipedia]
The shapes example "Design elements - Fluid power equipment" was created using the ConceptDraw PRO diagramming and vector drawing software extended with the Mechanical Engineering solution from the Engineering area of ConceptDraw Solution Park.
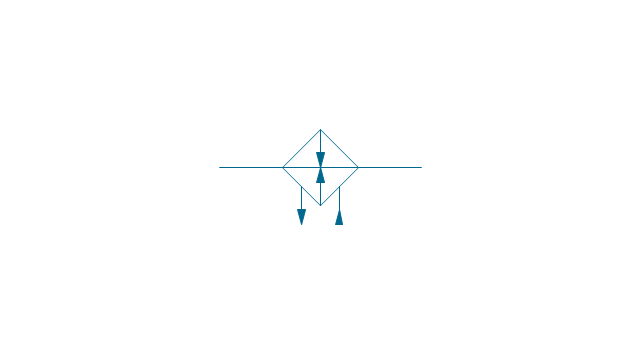
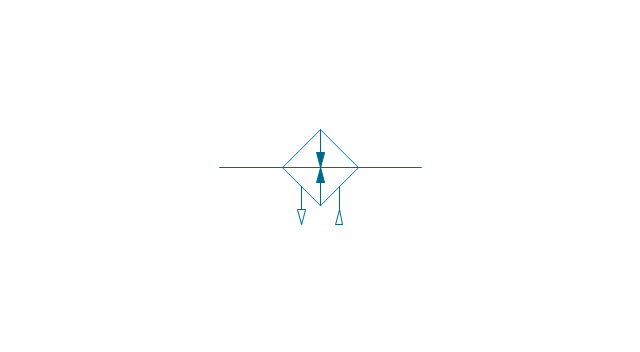
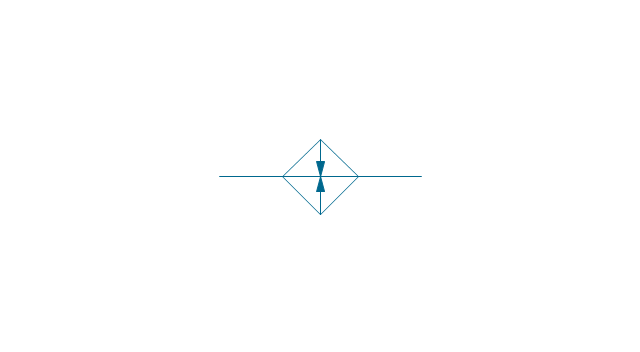
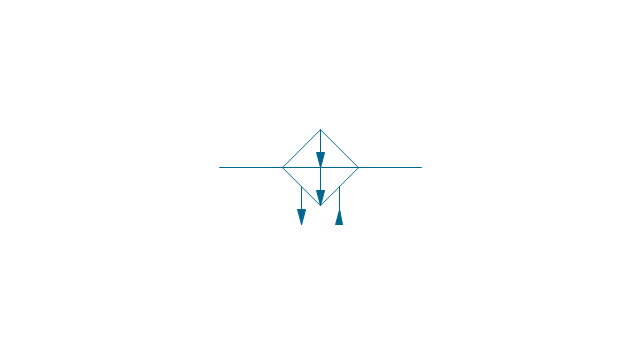
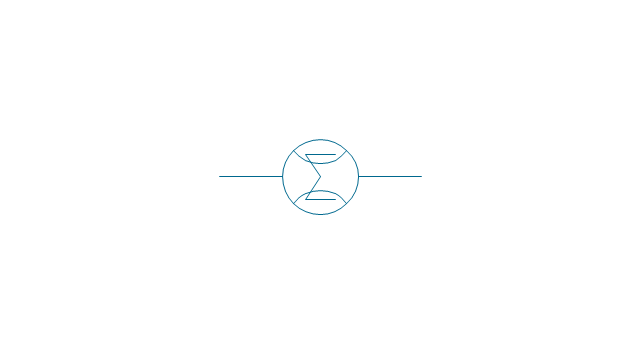
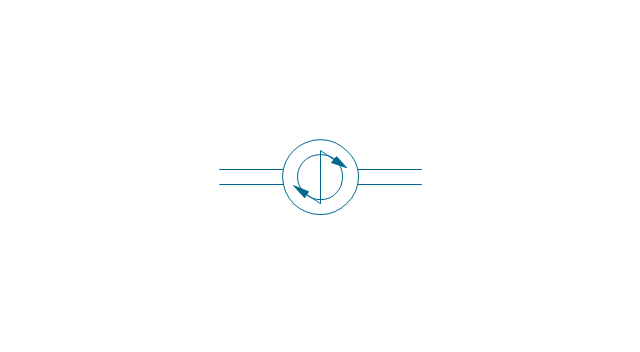
Fluid power symbols
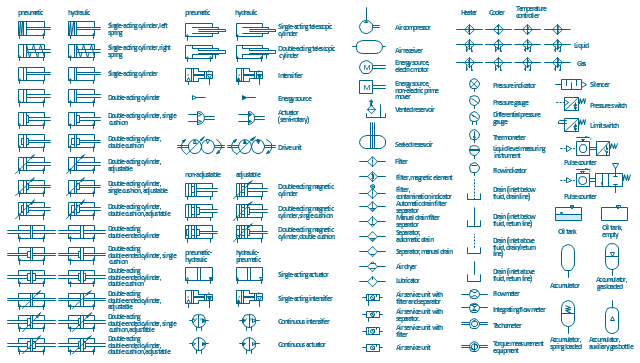
The vector stencils library "Fluid power equipment" contains 113 symbols of hydraulic and pneumatic equipment including pumps, motors, air compressors, cylinders, meters, gauges, and actuators.
Use it to design fluid power and hydraulic control systems in the ConceptDraw PRO diagramming and vector drawing software extended with the Mechanical Engineering solution from the Engineering area of ConceptDraw Solution Park.
www.conceptdraw.com/ solution-park/ engineering-mechanical
Use it to design fluid power and hydraulic control systems in the ConceptDraw PRO diagramming and vector drawing software extended with the Mechanical Engineering solution from the Engineering area of ConceptDraw Solution Park.
www.conceptdraw.com/ solution-park/ engineering-mechanical
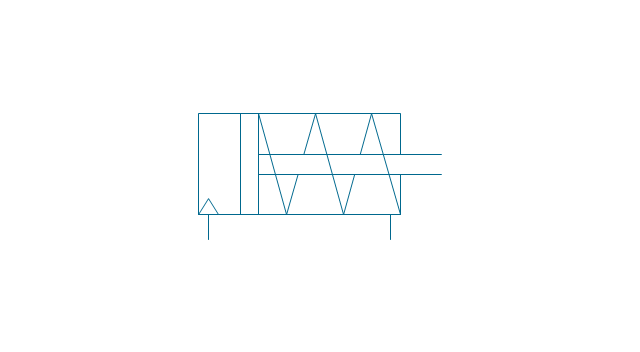
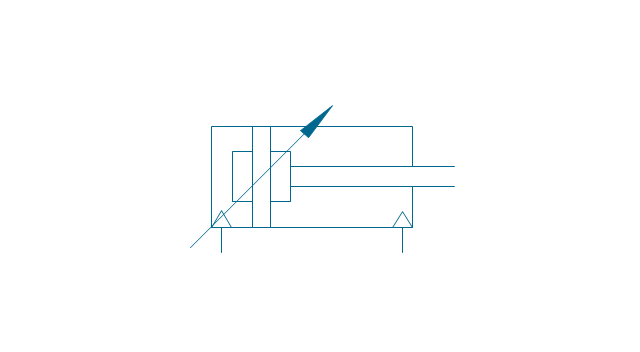
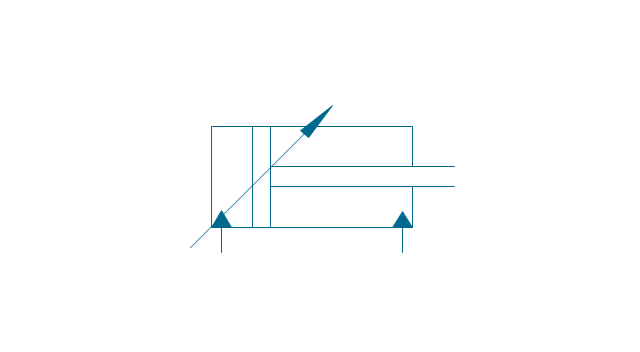
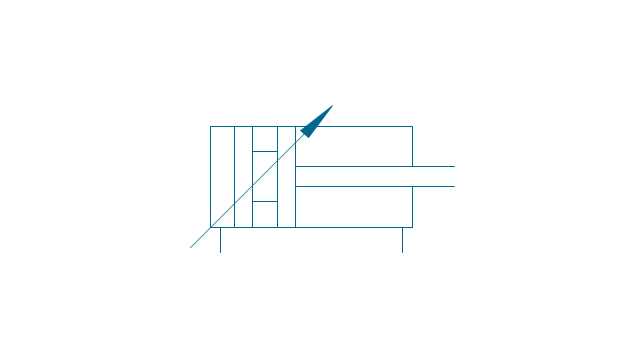
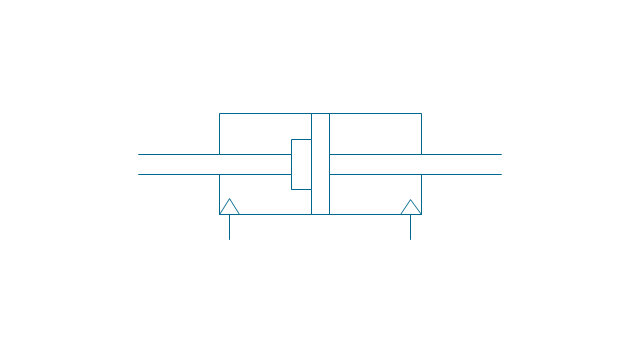
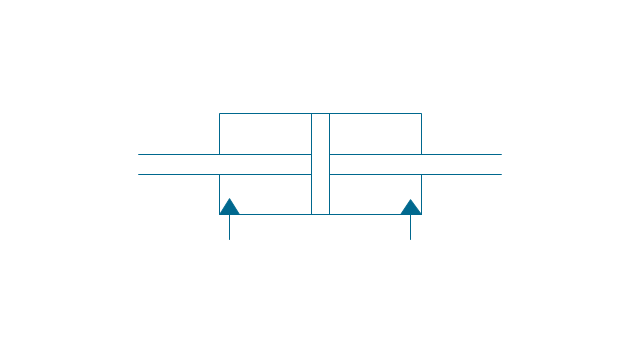
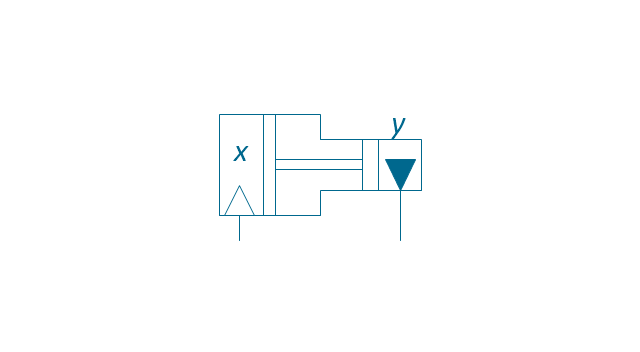
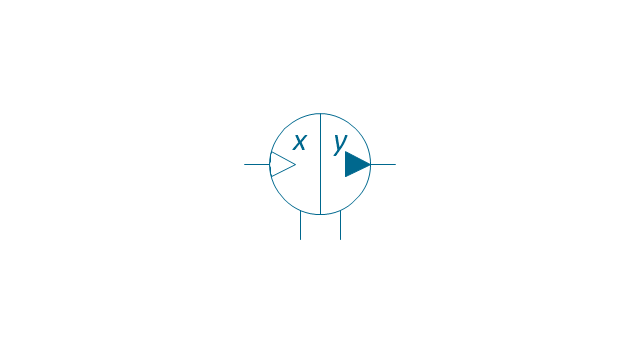
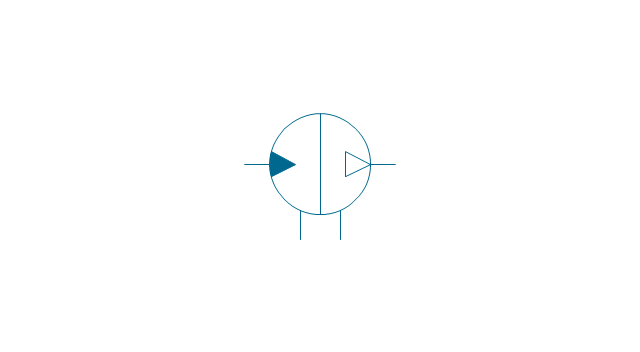
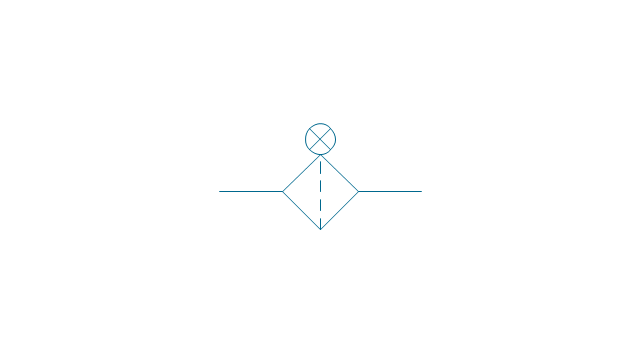
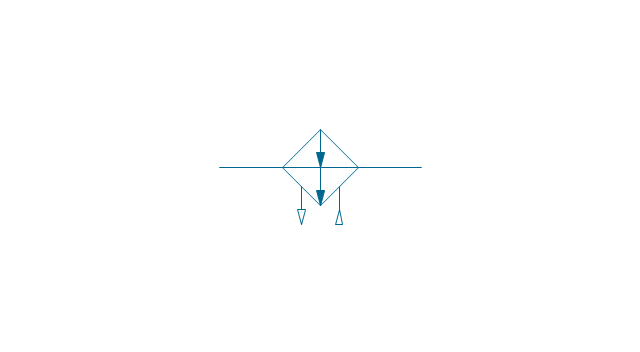
Actuator (semi-rotary), pneumatic
,-pneumatic-fluid-power-equipment---vector-stencils-library.png--diagram-flowchart-example.png)
Actuator (semi-rotary), hydraulic
,-hydraulic-fluid-power-equipment---vector-stencils-library.png--diagram-flowchart-example.png)
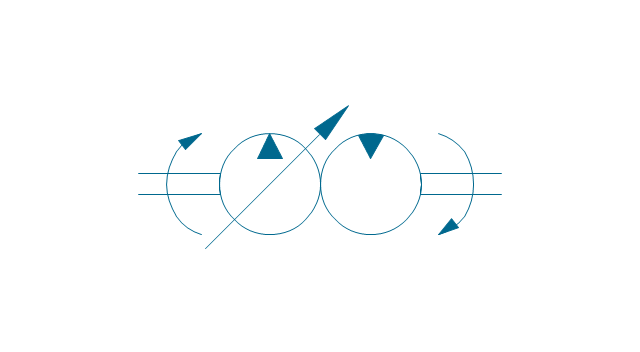
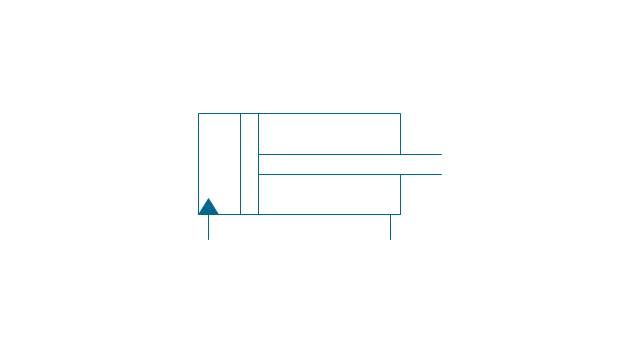
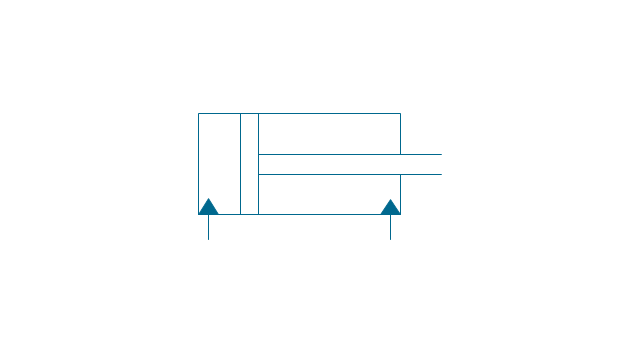
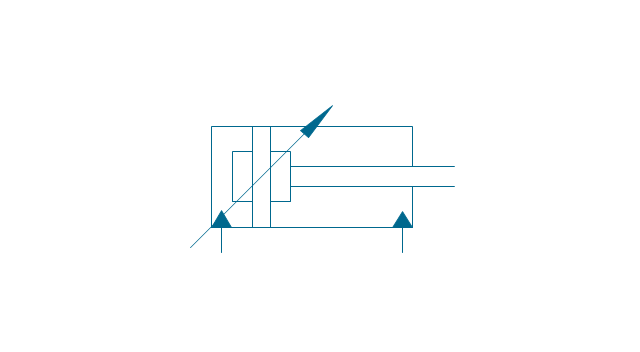
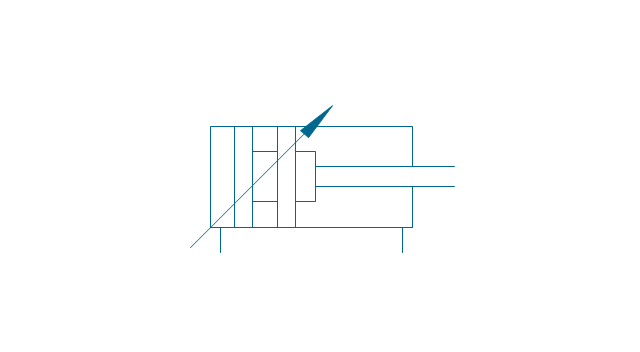
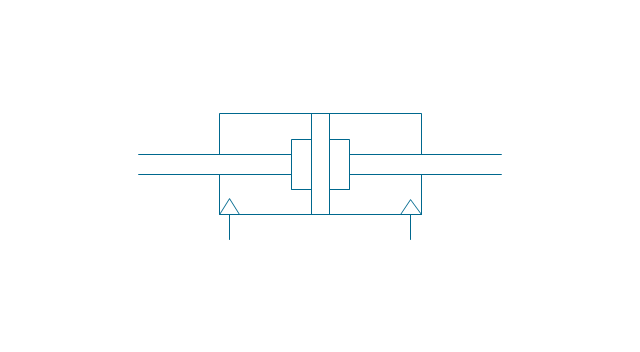
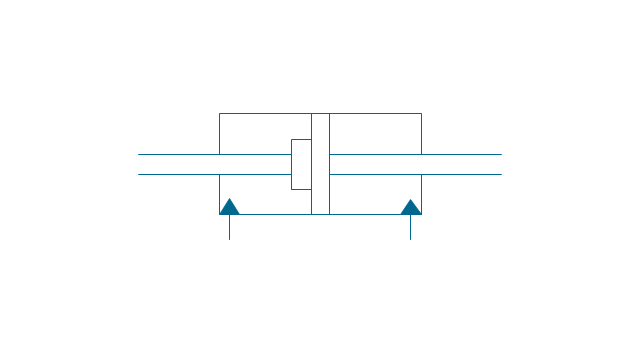
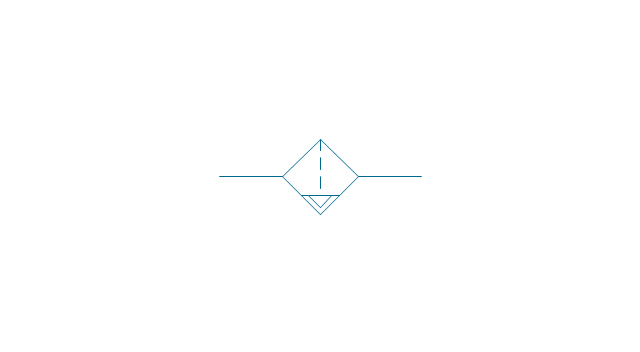
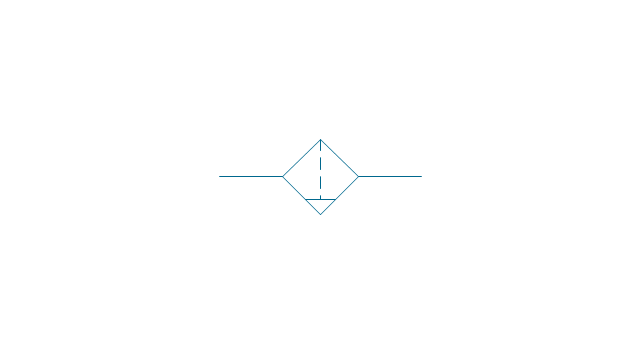
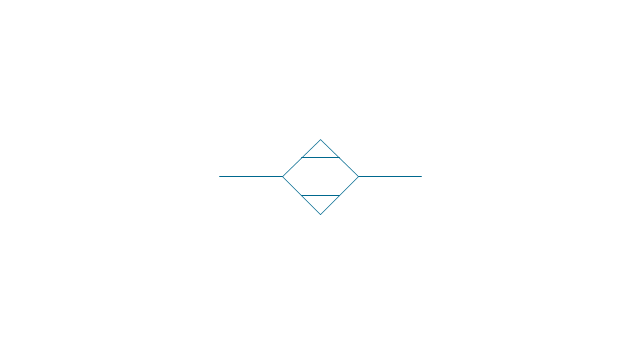
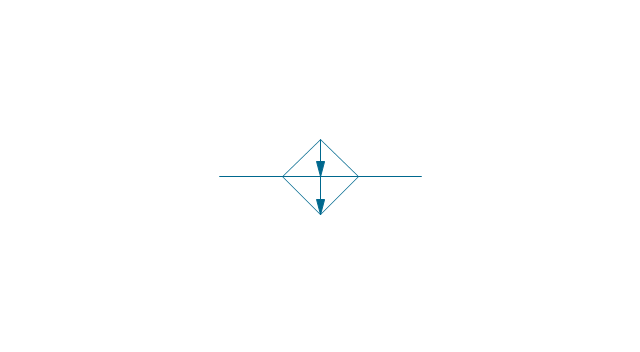
Drive unit, pneumatic
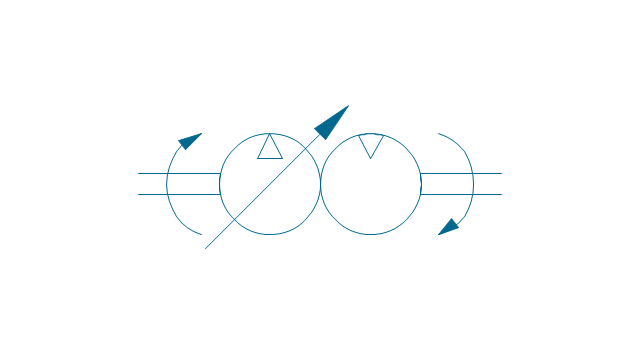
Drive unit, hydraulic
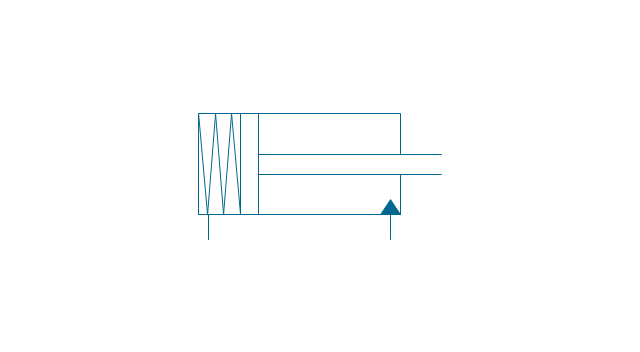
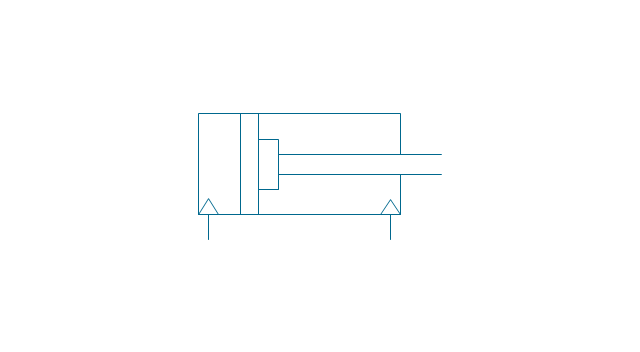
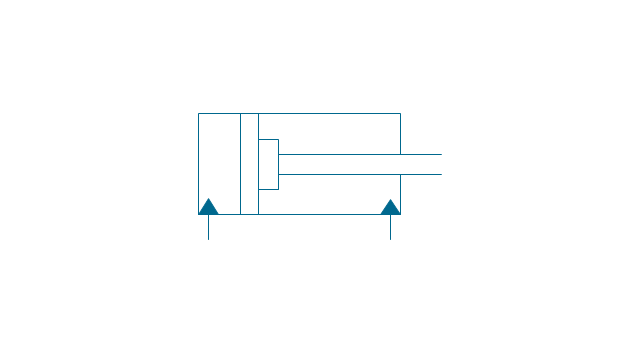
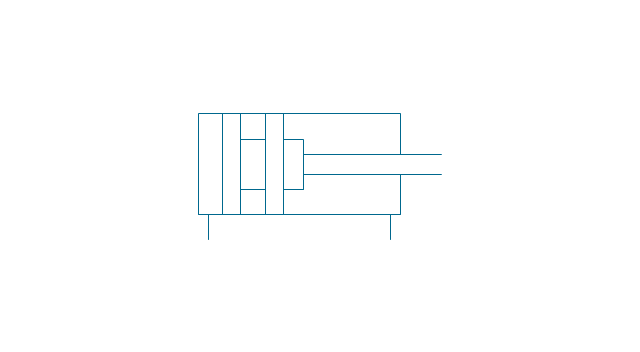
Sgl-act. cylinder, pneum., left spring

Sgl-act. cylinder, pneum., right spring
Sgl-act. cylinder, pneumatic

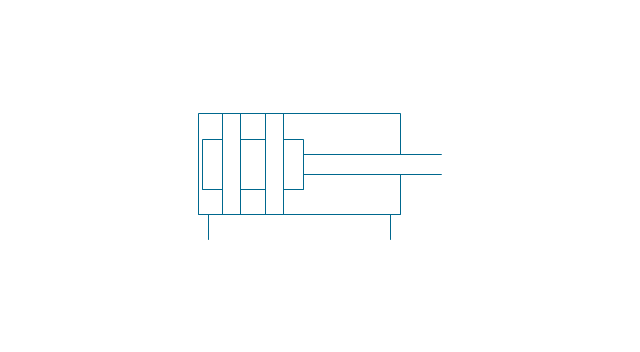
Sgl-act. cylinder, hydr., left spring
Sgl-act. cylinder, hydr., right spring
Sgl-act. cylinder, hydraulic
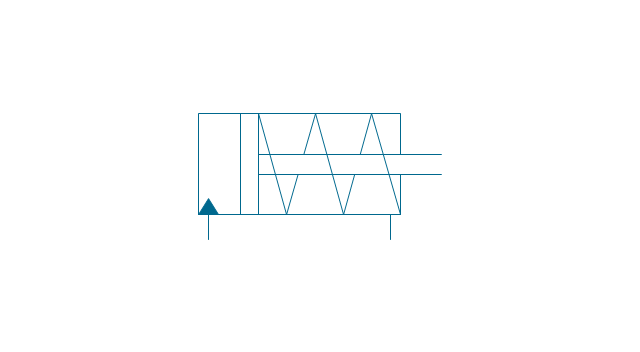
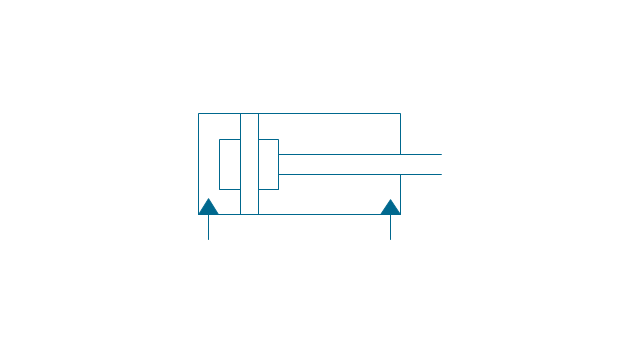
Dbl-act. cylinder, pneumatic
Dbl-act. cylinder, pneum., sgl cushion
Dbl-act. cylinder, pneum., dbl cushion
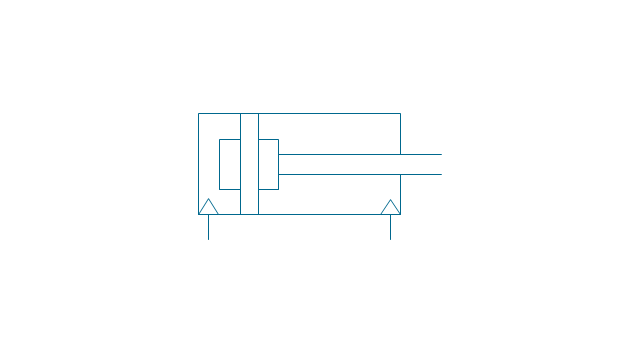
Dbl-act. cylinder, pneum., adjustable
Dbl-act. cylinder, pneum., sgl cushion, adj.
Dbl-act. cylinder, pneum., dbl cushion, adj.
Dbl-act. cylinder, hydraulic
Dbl-act. cylinder, hydr., sgl cushion
Dbl-act. cylinder, hydr., dbl cushion
Dbl-act. cylinder, hydr., adjustable
Dbl-act. cylinder, hydr., sgl cushion, adj.

Dbl-act. cylinder, hydr., dbl cushion, adj.
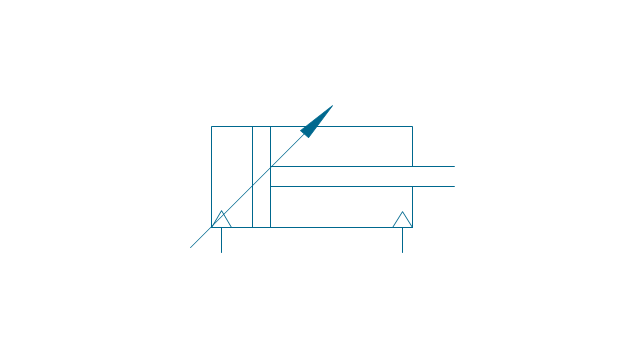
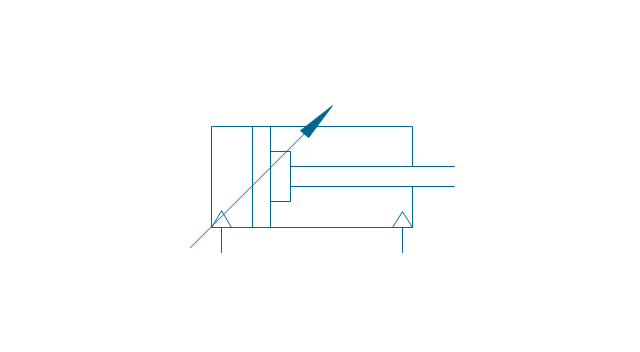
Dbl-act. cylinder, magnetic

Dbl-act. cylinder, magn., sgl cushion
Dbl-act. cylinder, magn., dbl cushion
Dbl-act. cylinder, magn., adjustable
Dbl-act. cylinder, magn., sgl cushion, adj.
Dbl-act. cylinder, magn., dbl cushion, adj.
Dbl-act. dbl-end. cylinder, pneumatic
Dbl-act. dbl-end. cylinder, pneum., sgl cushion
Dbl-act. dbl-end. cylinder, pneum., dbl cushion
Dbl-act. dbl-end. cylinder, pneum., adjustable
Dbl-act. dbl-end. cylinder, pneum., sgl cushion, adj.

Dbl-act. dbl-end. cylinder, pneum., dbl cushion, adj.
Dbl-act. dbl-end. cylinder, hydraulic
Dbl-act. dbl-end. cylinder, hydr., sgl cushion
Dbl-act. dbl-end. cylinder, hydr., dbl cushion
Dbl-act. dbl-end. cylinder, hydr., adjustable
Dbl-act. dbl-end. cylinder, hydr., sgl cushion, adj.
Dbl-act. dbl-end. cylinder, hydr., dbl cushion, adj.

Telescopic cylinder, pneum., dbl-act.
Telescopic cylinder, hydr., dbl-act.
Telescopic cylinder, pneum., sgl-act.

Telescopic cylinder, hydr., sgl-act.

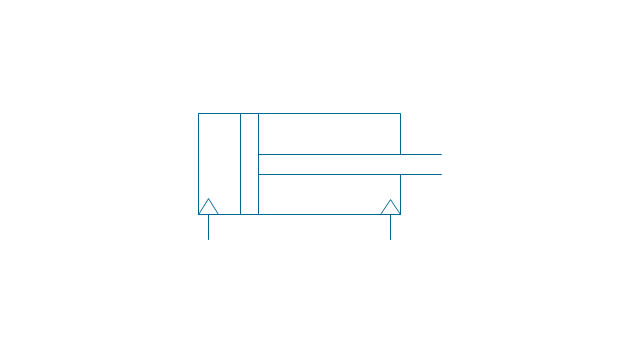
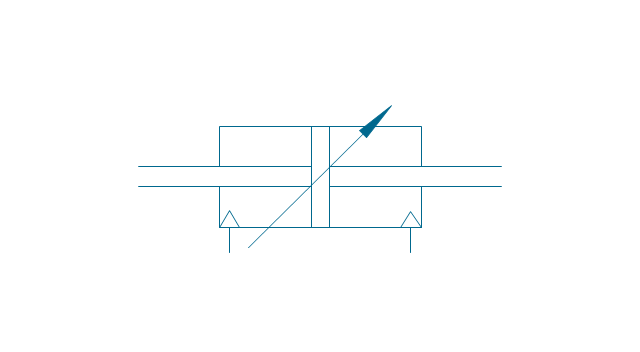
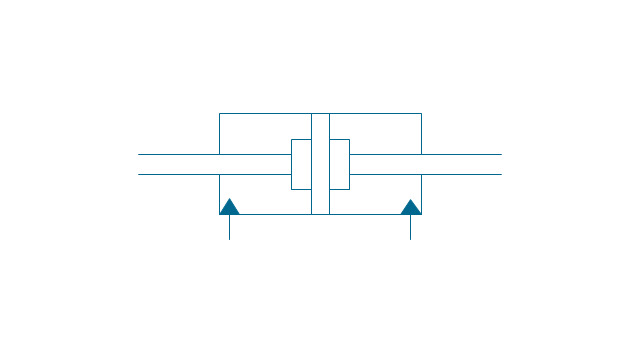
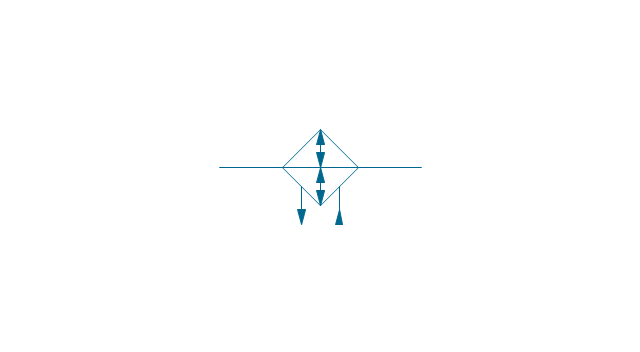
Actuator, hydraulic-pneumatic
Actuator, pneumatic-hydraulic
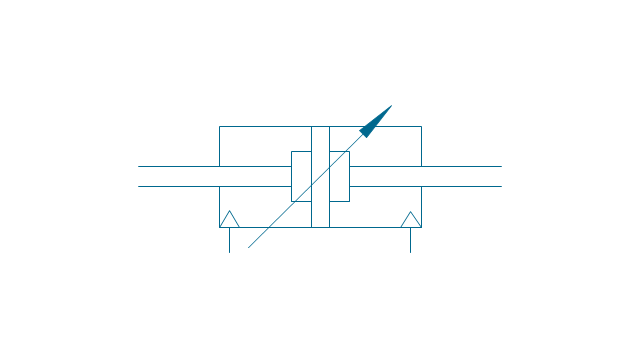
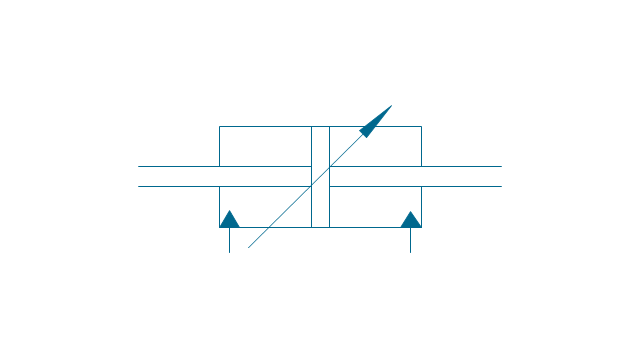
Intensifier, pneumatic
Intensifier, hydraulic
Intensifier, hydraulic-pneumatic
Intensifier, pneumatic-hydraulic
Intensifier, pneumatic-hydraulic
Intensifier, hydraulic-pneumatic

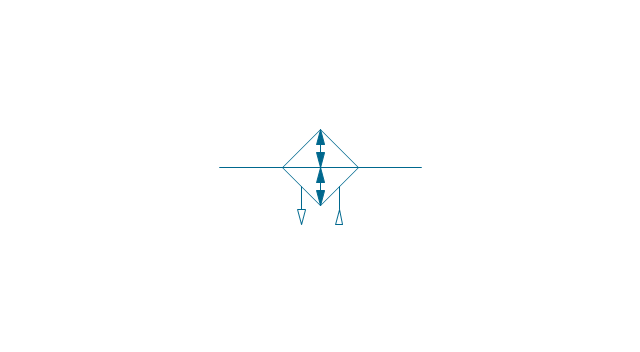
Actuator, pneumatic-hydraulic

Actuator, hydraulic-pneumatic
Accumulator
Accumulator, gas loaded
Accumulator, spring loaded
Accumulator, auxiliary gas bottle
Air receiver

Energy source, pneumatic

Energy source, hydraulic

Energy source, electric motor
Energy source, non-electric prime mover
Vented reservoir

Sealed reservoir
Filter
Filter, magnetic element
Filter, contamination indicator
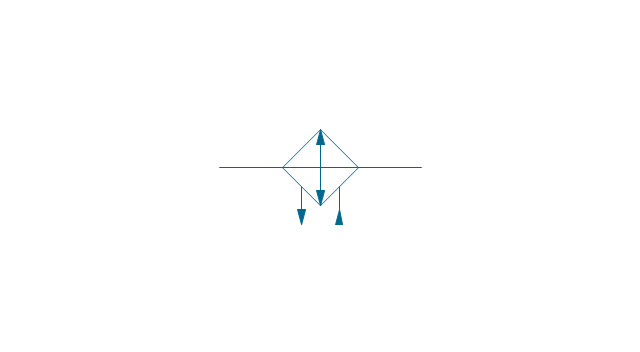
Automatic drain filter separator
Manual drain filter separator
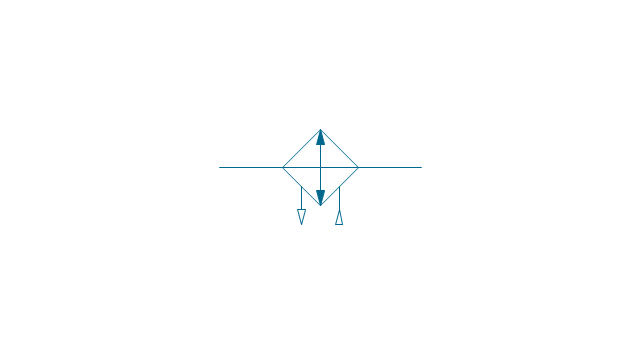
Separator, automatic drain

Separator, manual drain

Air dryer
Lubricator
Air service unit, filter, separator
Air service unit, separator
Air service unit, filter
Air service unit
Liquid cooler
Gas cooler
Cooler
Liquid heater
Gas heater
Heater
Liquid temperature controller
Gas temperature controller
Temperature controller
Liquid temperature controller 2
Gas temperature controller 2
Temperature controller 2

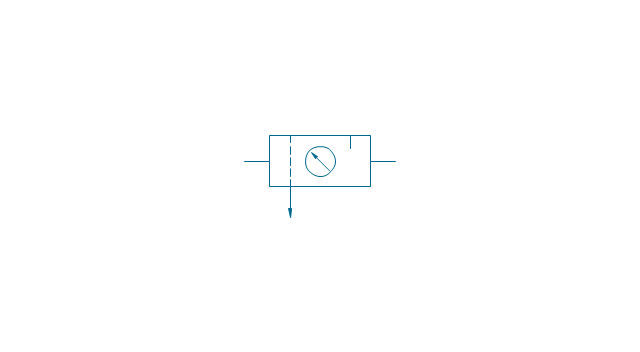
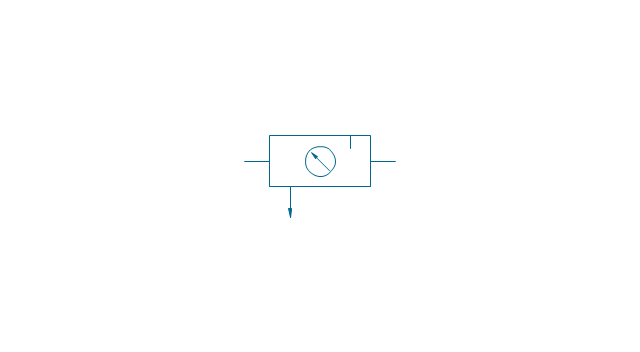
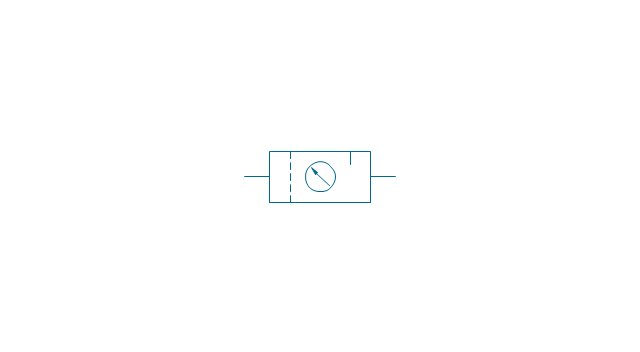
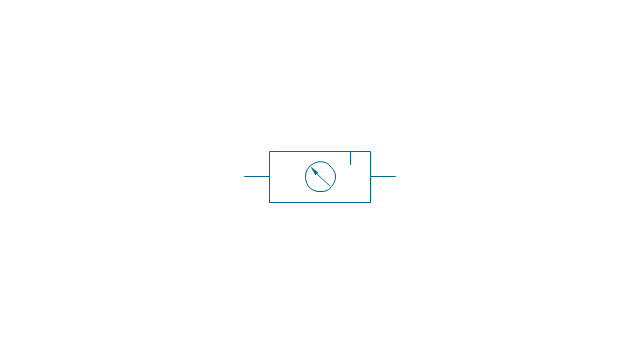
Pressure indicator
Pressure gauge

Differential pressure gauge

Thermometer

Liquid level measuring instrument
Flow indicator
Flow meter
Integrating flow meter
Tachometer

Torque measurement equipment
Pressure switch

Limit switch

Transducer

Pulse counter
Pulse counter 2
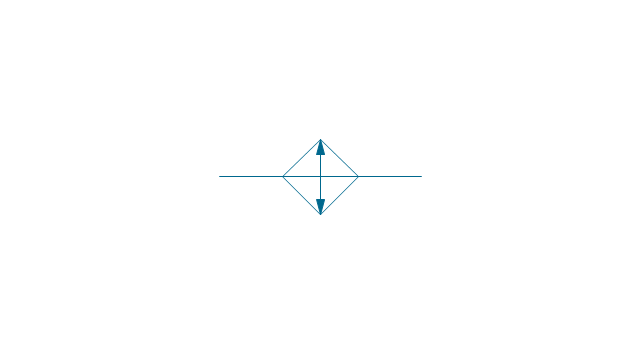
Silencer
Drain (inlet below fluid, drain line)
-fluid-power-equipment---vector-stencils-library.png--diagram-flowchart-example.png)
Drain (inlet below fluid, return line)
-fluid-power-equipment---vector-stencils-library.png--diagram-flowchart-example.png)
Drain (inlet above fluid, drain line)
-fluid-power-equipment---vector-stencils-library.png--diagram-flowchart-example.png)
Drain (inlet above fluid, return line)
-fluid-power-equipment---vector-stencils-library.png--diagram-flowchart-example.png)
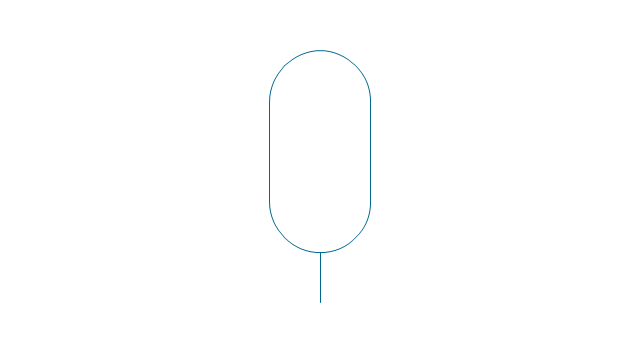
Oil tank
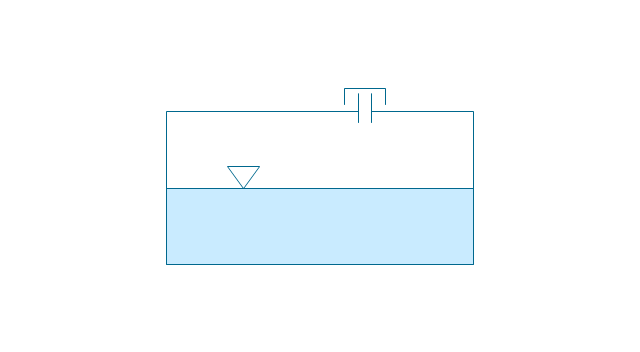
Oil tank, empty

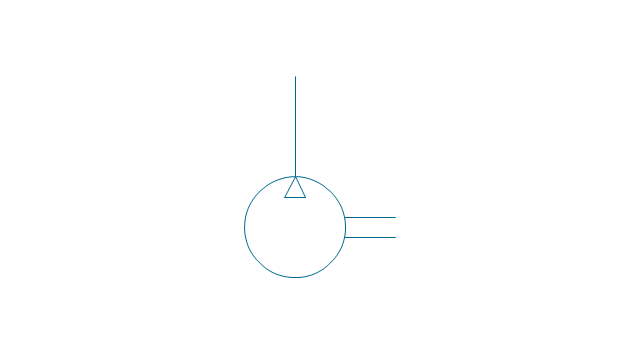
Air compressor
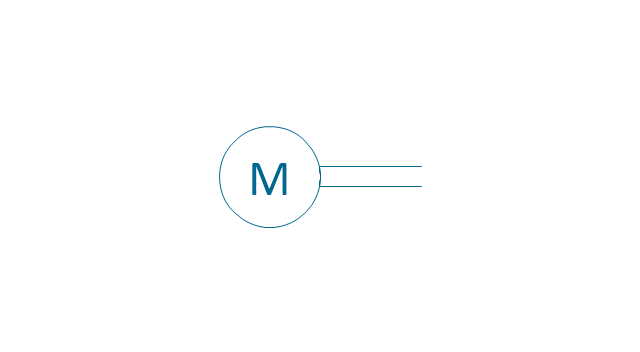
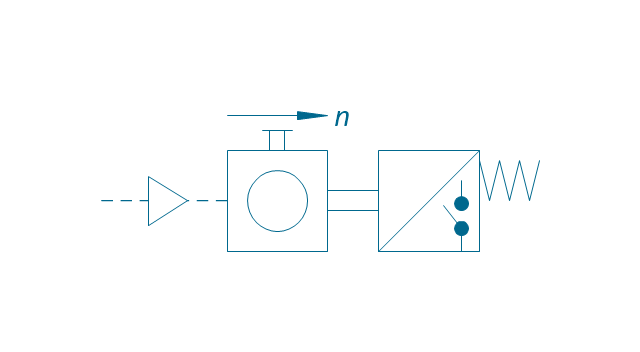
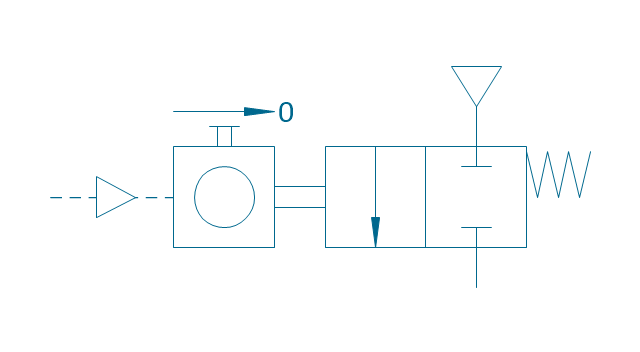
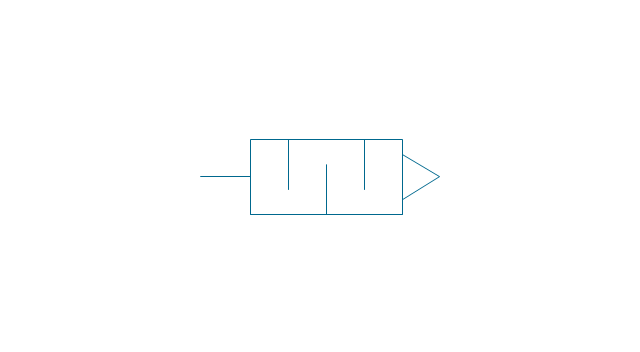
The vector stencils library "Pneumatic pumps and motors" contains 39 symbols of pneumatic pumps, motors and pump-motors for designing the engineering drawings of pneumatic circuits.
"A pneumatic motor or compressed air engine is a type of motor which does mechanical work by expanding compressed air. Pneumatic motors generally convert the compressed air energy to mechanical work through either linear or rotary motion. Linear motion can come from either a diaphragm or piston actuator, while rotary motion is supplied by either a vane type air motor or piston air motor." [Pneumatic motor. Wikipedia]
"A gas compressor is a mechanical device that increases the pressure of a gas by reducing its volume. An air compressor is a specific type of gas compressor.
Compressors are similar to pumps: both increase the pressure on a fluid and both can transport the fluid through a pipe. As gases are compressible, the compressor also reduces the volume of a gas. Liquids are relatively incompressible; while some can be compressed, the main action of a pump is to pressurize and transport liquids." [Gas compressor. Wikipedia]
The shapes example "Design elements - Pneumatic pumps and motors" was created using the ConceptDraw PRO diagramming and vector drawing software extended with the Mechanical Engineering solution from the Engineering area of ConceptDraw Solution Park.
Pneumatic pump and motor symbols
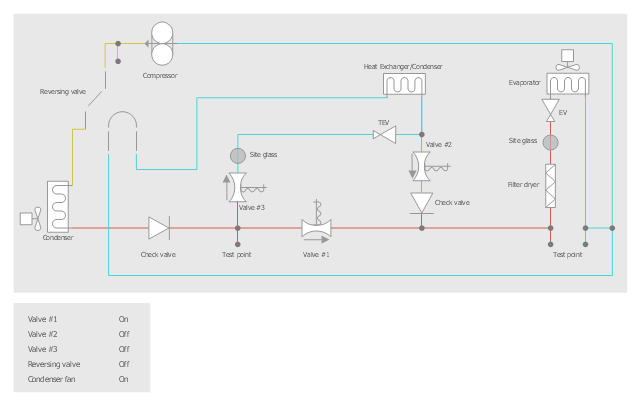
This HVAC schematics sample depicts the house cool mode of central air pool heater. It was drawn on the base of the HVAC schematics in the post "Central Air Pool Heater" from the Nathan Stratton's blog.
"With House Cool Mode, hot gas leaves the compressor runs through the reversing value into the condenser where it condenses into a liquid. Valve #1 is ON so liquid is able to leave the outside unit and run through the filter dryer and site glass into the evaporator upstairs in the house where the liquid flashes into a gas as it passes through the expansion valve and absorbs heat from the air passing through the evaporator. The cold gas travels downstairs and outside to the compressor and the cycle starts all over again." [robotics.net/ projects/ central-air-pool-heater/ ]
The HVAC schematics example "Central air pool heater" was created using the ConceptDraw DIAGRAM diagramming and vector drawing software extended with the HVAC Plans solution from the Building Plans area of ConceptDraw Solution Park.
HVAC schematics
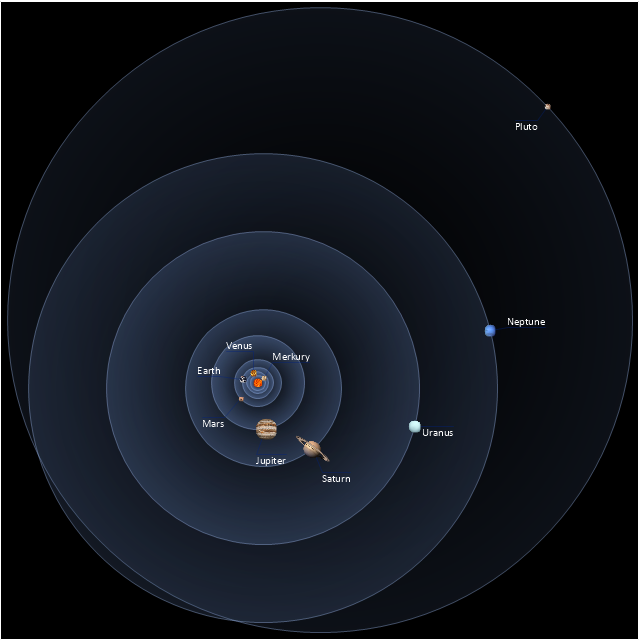
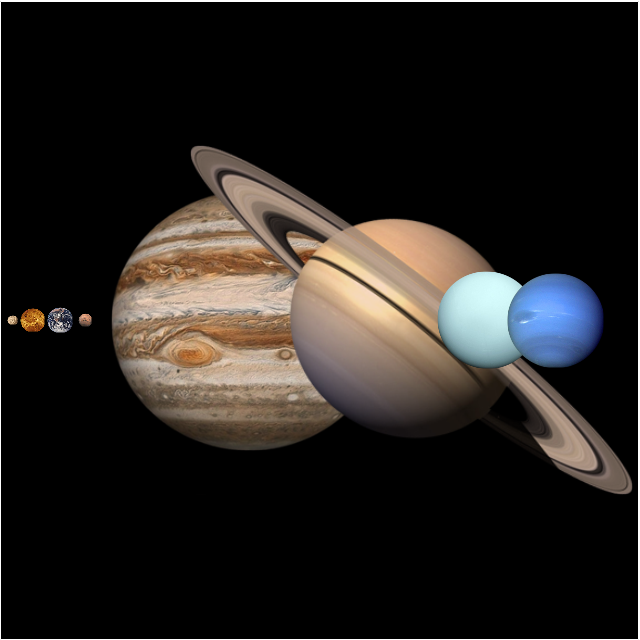
This vector stencils library contains 30 clipart images and astronomical symbols of sun and stars, solar system planets and moon.
Use these shapes for drawing your astronomical diagrams and illustrations.
Use these shapes for drawing your astronomical diagrams and illustrations.
Solar system
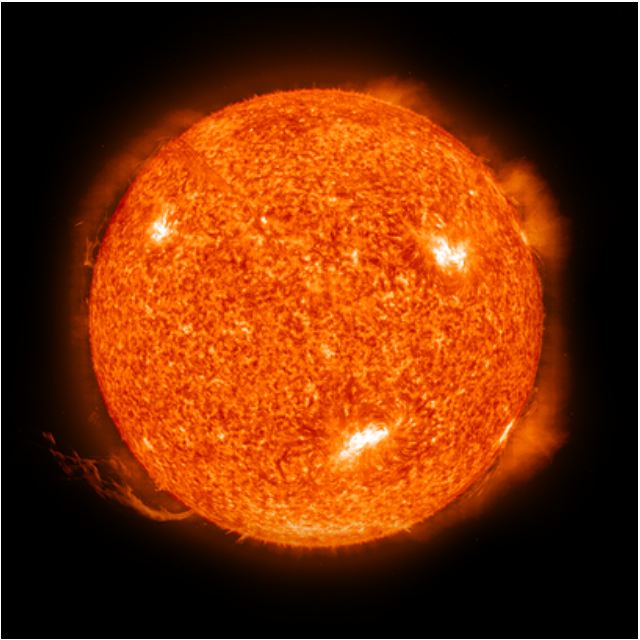
Sun
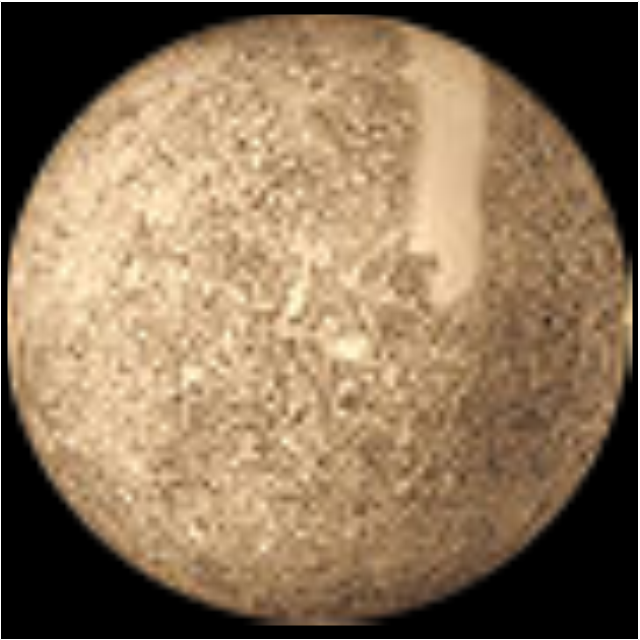
Mercury
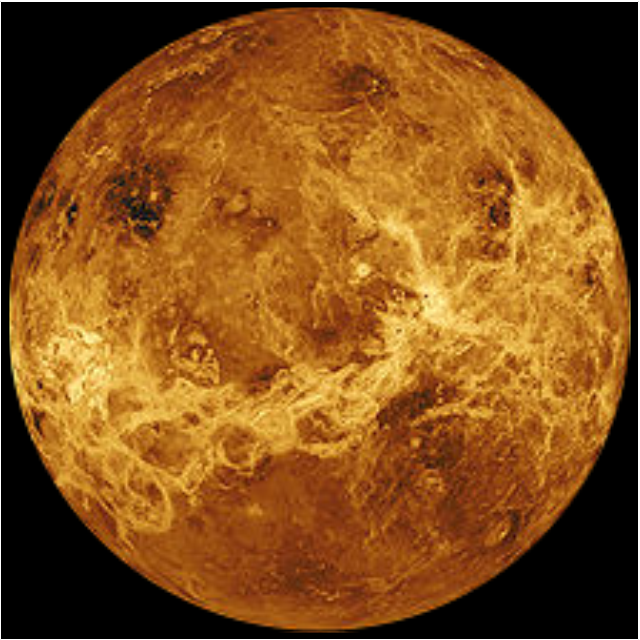
Venus
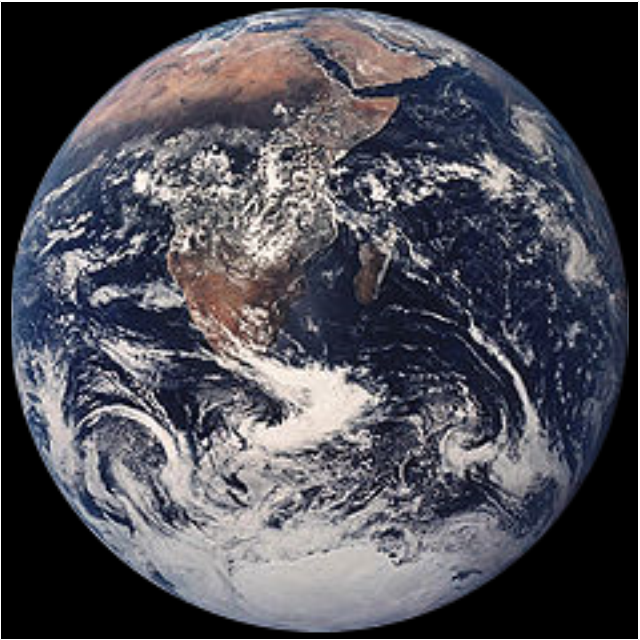
Earth
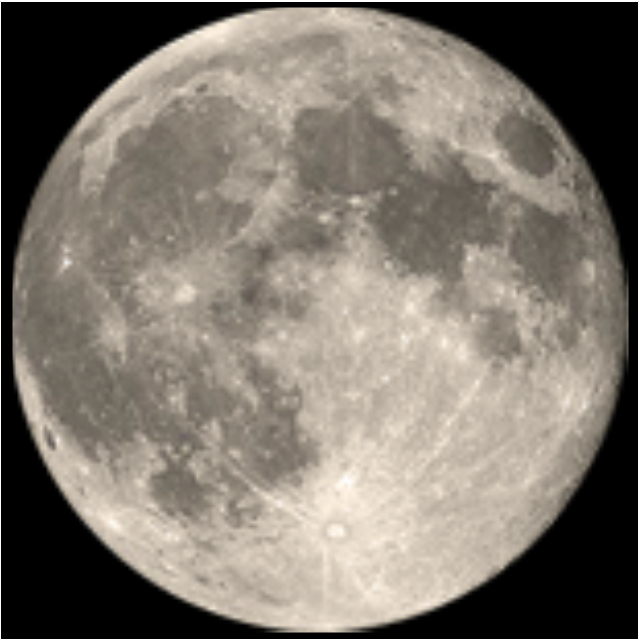
Moon
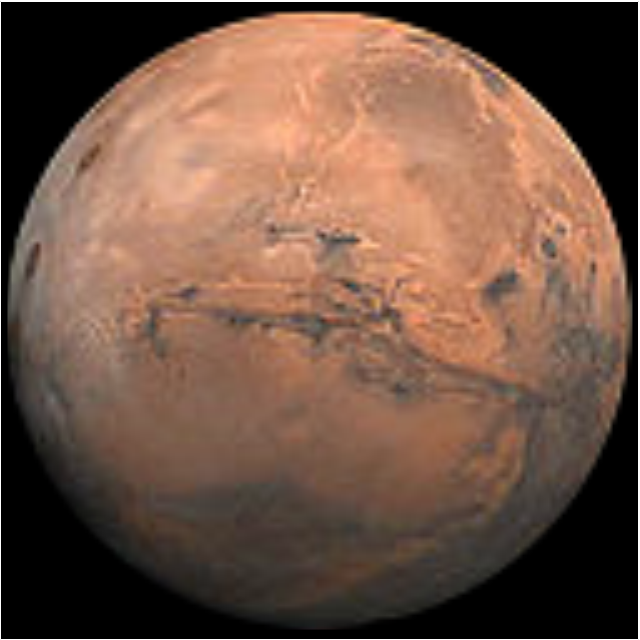
Mars
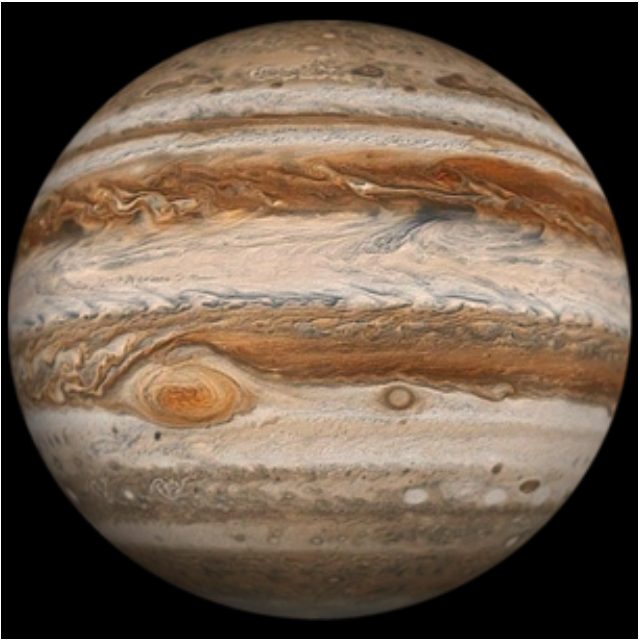
Jupiter
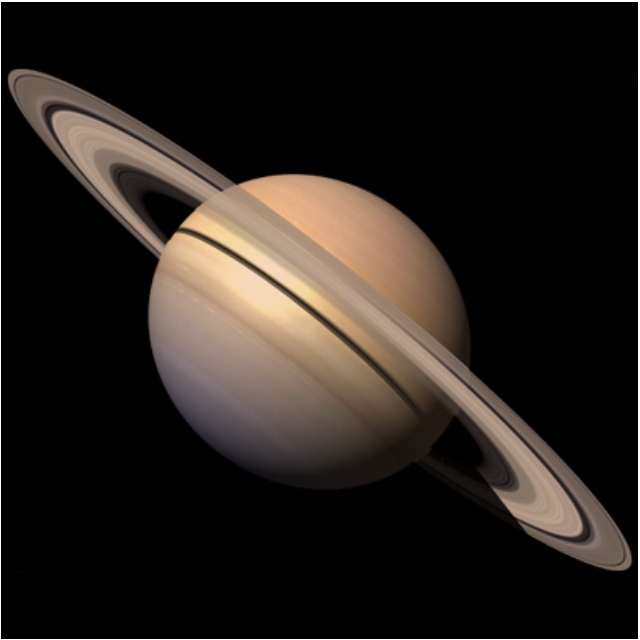
Saturn
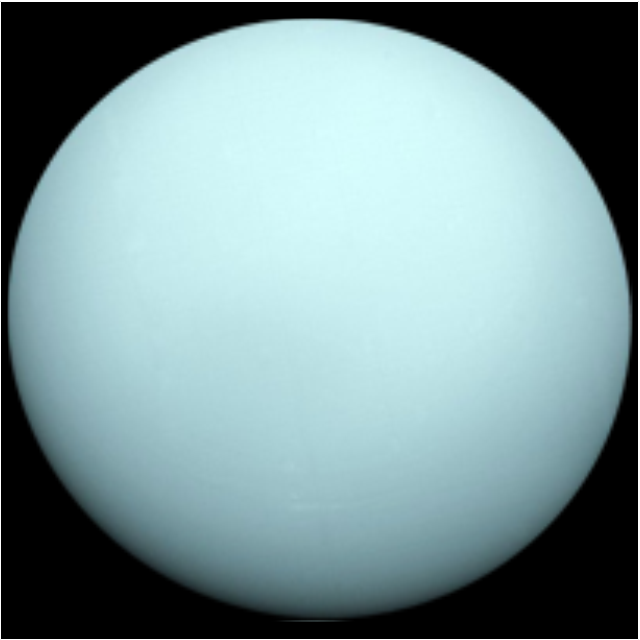
Uranus
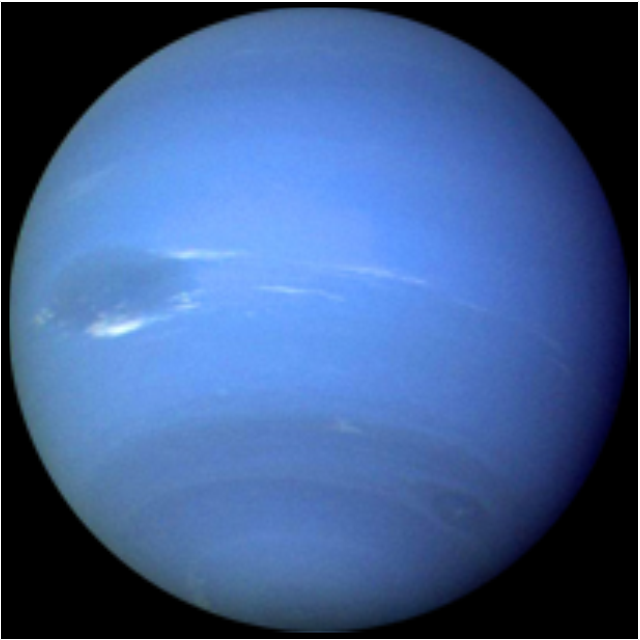
Neptune
Pluto
Red giant
Yellow giant

Blue giant

Red dwarf
White dwarf

Black hole
Planets to scale
Sun symbol
Mercury symbol
Venus symbol
Earth symbol
Moon symbol

Mars symbol
Jupiter symbol

Saturn symbol

Neptune symbol
Uranus symbol
Pluto symbol

 Pie Charts
Pie Charts are extensively used in statistics and business for explaining data and work results, in mass media for comparison (i.e. to visualize the percentage for the parts of one total), and in many other fields. The Pie Charts solution for ConceptDraw DIAGRAM offers powerful drawing tools, varied templates, samples, and a library of vector stencils for simple construction and design of Pie Charts, Donut Chart, and Pie Graph Worksheets.
"Consumption of energy resources, (e.g. turning on a light) requires resources and has an effect on the environment. Many electric power plants burn coal, oil or natural gas in order to generate electricity for energy needs. While burning these fossil fuels produces a readily available and instantaneous supply of electricity, it also generates air pollutants including carbon dioxide (CO2), sulfur dioxide and trioxide (SOx) and nitrogen oxides (NOx). Carbon dioxide is an important greenhouse gas which is thought to be responsible for some fraction of the rapid increase in global warming seen especially in the temperature records in the 20th century, as compared with tens of thousands of years worth of temperature records which can be read from ice cores taken in Arctic regions. Burning fossil fuels for electricity generation also releases trace metals such as beryllium, cadmium, chromium, copper, manganese, mercury, nickel, and silver into the environment, which also act as pollutants.
The large-scale use of renewable energy technologies would "greatly mitigate or eliminate a wide range of environmental and human health impacts of energy use". Renewable energy technologies include biofuels, solar heating and cooling, hydroelectric power, solar power, and wind power. Energy conservation and the efficient use of energy would also help." [Energy industry. Environmental impact. Wikipedia]
The Energy resources diagram example was created in the ConceptDraw PRO diagramming and vector drawing software using the Manufacturing and Maintenance solution from the Illustration area of ConceptDraw Solution Park.
Infographics

This ecology infographic example was created on the base of the infographics "Greenhouse gas emissions in the EU" from the Debating Europe website. [debatingeurope.eu/ wp-content/ uploads/ 2013/ 06/ TH_ 2_ social.png]
"A greenhouse gas (sometimes abbreviated GHG) is a gas in an atmosphere that absorbs and emits radiation within the thermal infrared range. This process is the fundamental cause of the greenhouse effect. The primary greenhouse gases in the Earth's atmosphere are water vapor, carbon dioxide, methane, nitrous oxide, and ozone. Greenhouse gases greatly affect the temperature of the Earth; without them, Earth's surface would average about 33 °C colder, which is about 59 °F below the present average of 14 °C (57 °F)." [Greenhouse gas. Wikipedia]
The ecology infographic example "EU greenhouse gas emissions" was created using the ConceptDraw PRO diagramming and vector drawing software extended with the Management Infographics solition from the area "Business Infographics" in ConceptDraw Solution Park.
Ecology infographics example

Used Solutions
Pie Graph Worksheets

- Percentage Pie Chart. Pie Chart Examples | Atmosphere air ...
- Percentage Pie Chart. Pie Chart Examples | Atmosphere air ...
- Blank Scatter Plot | Percentage Of Gases Present In Air
- Percentage Pie Chart. Pie Chart Examples - Conceptdraw.com
- Atmosphere air composition | Design elements - Composition charts ...
- Basic Pie Charts | Gases That Make Up Air And Their Percentages
- Percentage Pie Chart. Pie Chart Examples | Atmosphere air ...
- Atmosphere air composition | Pie Chart Examples and Templates ...
- Atmosphere air composition | Percentage Pie Chart. Pie Chart ...