This Water cycle diagram example was drawn using the ConceptDraw PRO diagramming and vector graphics software extended with the clipart libraries Geography and Weather.
"The water cycle, also known as the hydrologic cycle or the H2O cycle, describes the continuous movement of water on, above and below the surface of the Earth. The mass water on Earth remains fairly constant over time but the partitioning of the water into the major reservoirs of ice, fresh water, saline water and atmospheric water is variable depending on a wide range of climatic variables. The water moves from one reservoir to another, such as from river to ocean, or from the ocean to the atmosphere, by the physical processes of evaporation, condensation, precipitation, infiltration, runoff, and subsurface flow. In so doing, the water goes through different phases: liquid, solid (ice), and gas (vapor)." [Water cycle. Wikipedia]
This water cycle diagram example is included in the Nature solution from the Illustration area of ConceptDraw Solution Park.
Vector illustration

Drawing Illustration

Drawing a Nature Scene

Beauty in nature Illustrations and Clipart

 Nature
This solution extends ConceptDraw DIAGRAM software with samples, templates and libraries of vector clipart for drawing the Nature illustrations. Use it to make professional-looking documents, presentations and websites illustrated with color scalable vector c
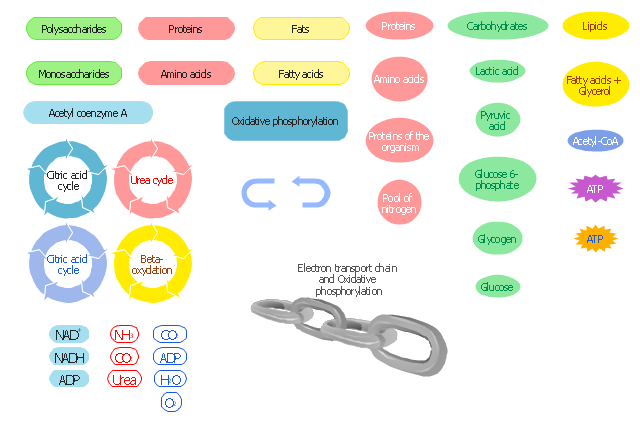
The vector stencils library "Citric acid cycle (TCA cycle)" contains 26 symbols of metabolites for drawing metabolic pathway maps and biochemical shematic diagrams of the citric acid cycle (TCA cycle, tricarboxylic acid cycle, Krebs cycle) and diagrams of metabolism processes.
"The citric acid cycle - also known as the tricarboxylic acid cycle (TCA cycle), or the Krebs cycle, - is a series of chemical reactions used by all aerobic organisms to generate energy through the oxidation of acetate derived from carbohydrates, fats and proteins into carbon dioxide and chemical energy in the form of adenosine triphosphate (ATP). In addition, the cycle provides precursors of certain amino acids as well as the reducing agent NADH that is used in numerous other biochemical reactions. Its central importance to many biochemical pathways suggests that it was one of the earliest established components of cellular metabolism and may have originated abiogenically.
The name of this metabolic pathway is derived from citric acid (a type of tricarboxylic acid) that is consumed and then regenerated by this sequence of reactions to complete the cycle. In addition, the cycle consumes acetate (in the form of acetyl-CoA) and water, reduces NAD+ to NADH, and produces carbon dioxide as a waste byproduct. The NADH generated by the TCA cycle is fed into the oxidative phosphorylation (electron transport) pathway. The net result of these two closely linked pathways is the oxidation of nutrients to produce usable chemical energy in the form of ATP." [Citric acid cycle. Wikipedia]
The shapes example "Design elements - TCA cycle" is included in the Biology solution from the Science and Education area of ConceptDraw Solution Park.
Tricarboxylic acid cycle (Krebs cycle) symbols
-symbols--design-elements---tca-cycle.png--diagram-flowchart-example.png)
"Ecosystems represent sources of natural capital and provide goods and services to society, also called ecosystem services. The Millennium Ecosystem Assessment identified over 24 ecosystem services that can be divided up into 4 general groups including: 1) provisioning, 2) supporting, 3) regulating and 4) cultural." [User:Sawtoothgirl/ Sustainable Real Estate Development. Wikipedia]
"Humankind benefits in a multitude of ways from ecosystems. Collectively, these benefits are known as ecosystem services. Ecosystem services are regularly involved in the provisioning of clean drinking water and the decomposition of wastes. While scientists and environmentalists have discussed ecosystem services implicitly for decades, these the ecosystem services concept itself was popularized by the Millennium Ecosystem Assessment (MA) in the early 2000s. This grouped ecosystem services into four broad categories: provisioning, such as the production of food and water; regulating, such as the control of climate and disease; supporting, such as nutrient cycles and crop pollination; and cultural, such as spiritual and recreational benefits. To help inform decision-makers, many ecosystem services are being assigned economic values." [Ecosystem services. Wikipedia]
The segmented pyramid diagram example "Ecosystem goods and services" was redesigned using the ConceptDraw PRO diagramming and vector drawing software from Wikimedia Commons file ES_ triangle.png.
[commons.wikimedia.org/ wiki/ File:ES_ triangle.png]
This file is licensed under the Creative Commons Attribution-Share Alike 3.0 Unported license. [creativecommons.org/ licenses/ by-sa/ 3.0/ deed.en]
This segmented pyramid diagram example "Ecosystem goods and services" is included in the Pyramid Diagrams solution from the Marketing area of ConceptDraw Solution Park.
Pyramid diagram

BPR Diagram. Business Process Reengineering Example

This circular arrows diagram sample depicts the Plan–Do–Check–Act cycle.
"PDCA (plan–do–check–act or plan–do–check–adjust) is an iterative four-step management method used in business for the control and continuous improvement of processes and products. It is also known as the Deming circle/ cycle/ wheel, Shewhart cycle, control circle/ cycle, or plan–do–study–act (PDSA). Another version of this PDCA cycle is OPDCA. The added "O" stands for observation or as some versions say "Grasp the current condition." This emphasis on observation and current condition has currency with Lean manufacturing/ Toyota Production System literature." [PDCA. Wikipedia]
The diagram example "PDCA cycle" was created using the ConceptDraw PRO diagramming and vector drawing software extended with the Circular Arrows Diagrams solution from the area "What is a Diagram" of ConceptDraw Solution Park.
Circular arrows diagram

The cycle diagram sample was created on the base of the figure illustrating the webpage "2. POLICY & STRATEGY" of "Scottish Police College Primary Inspection 2006: A Report by Her Majesty's Inspectorate of Constabulary" from the Scottish Government website.
"Strategic Planning.
2.1 The planning process for the College currently follows a structured approach, starting in April and extending through the financial year. The planning cycle is illustrated in figure 2. ...
2.2 The College recognises the need to consult with its customers and stakeholders in the process of setting objectives and directing the training programme. The planning cycle to date refers to force visits, environmental scanning, the course planning process which involves consultation with all forces and other common police services, as well as to a survey of external providers.
2.3 The information from consultation feeds into an EFQM framework from which the College has identified four key policies, namely:
(1) developing and delivering quality training;
(2) developing our people through lifelong learning;
(3) continuous improvement of our service; and
(4) embracing the changing environment.
2.4 The objectives set at divisional level are designed to contribute to delivering these policies. HMIC found that whilst the selected objectives were presented in line with the structure, not all could be considered to meet SMART (Specific, Measurable, Achievable, Relevant and Timed) criteria. This failure indicates that while the process appears suitably structured to deliver a robust result, some of those involved could perhaps have a better understanding of the process." [scotland.gov.uk/ Publications/ 2007/ 02/ 15134652/ 8]
The cycle diagram example "Strategic planning" was created using the ConceptDraw PRO diagramming and vector drawing software extended with the Target and Circular Diagrams solution from the Marketing area of ConceptDraw Solution Park.
www.conceptdraw.com/ solution-park/ marketing-target-and-circular-diagrams
Cycle diagram

Piping and Instrumentation Diagram Software

Interior Design. Plumbing — Design Elements

This circle diagram sample was redesigned from the Wikimedia Commons file: Research cycle.png. "Some of the basic elements of the scientific method, arranged in a cycle to emphasize that it is an iterative process." [commons.wikimedia.org/ wiki/ File:Research_ cycle.png]
This file is licensed under the Creative Commons Attribution 2.0 Generic license. [creativecommons.org/ licenses/ by/ 2.0/ deed.en]
"The scientific method is a body of techniques for investigating phenomena, acquiring new knowledge, or correcting and integrating previous knowledge. To be termed scientific, a method of inquiry must be based on empirical and measurable evidence subject to specific principles of reasoning. ...
Four essential elements of the scientific method are iterations, recursions, interleavings, or orderings of the following:
(1) Characterizations (observations, definitions, and measurements of the subject of inquiry).
(2) Hypotheses (theoretical, hypothetical explanations of observations and measurements of the subject).
(3) Predictions (reasoning including logical deduction from the hypothesis or theory).
(4) Experiments (tests of all of the above)...
A linearized, pragmatic scheme of the four points above is sometimes offered as a guideline for proceeding:
(1) Define a question.
(2) Gather information and resources (observe).
(3) Form an explanatory hypothesis.
(4) Test the hypothesis by performing an experiment and collecting data in a reproducible manner.
(5) Analyze the data.
(6) Interpret the data and draw conclusions that serve as a starting point for new hypothesis.
(7) Publish results.
(8) Retest (frequently done by other scientists).
The iterative cycle inherent in this step-by-step method goes from point 3 to 6 back to 3 again." [Scientific method. Wikipedia]
The circle diagram example "Research cycle" was created using the ConceptDraw PRO diagramming and vector drawing software extended with the Target and Circular Diagrams solution from the Marketing area of ConceptDraw Solution Park.
www.conceptdraw.com/ solution-park/ marketing-target-and-circular-diagrams
Circle diagram

 Target and Circular Diagrams
This solution extends ConceptDraw DIAGRAM software with samples, templates and library of design elements for drawing the Target and Circular Diagrams.
The vector stencils library " Biochemistry of metabolism" contains 46 metabolite symbols for drawing metabolic pathways maps, biochemical diagrams and metabolism process flow charts using the ConceptDraw PRO diagramming and vector drawing software.
"Metabolites are the intermediates and products of metabolism. The term metabolite is usually restricted to small molecules. Metabolites have various functions, including fuel, structure, signaling, stimulatory and inhibitory effects on enzymes, catalytic activity of their own (usually as a cofactor to an enzyme), defense, and interactions with other organisms (e.g. pigments, odorants, and pheromones). A primary metabolite is directly involved in normal "growth", development, and reproduction. Alcohol is an example of a primary metabolite produced in large-scale by industrial microbiology. A secondary metabolite is not directly involved in those processes, but usually has an important ecological function. Examples include antibiotics and pigments such as resins and terpenes etc. ...
The metabolome forms a large network of metabolic reactions, where outputs from one enzymatic chemical reaction are inputs to other chemical reactions." [Metabolite. Wikipedia]
The shapes example "Design elements - Biochemistry of metabolism" is included in the Biology solution from the Science and Education area of ConceptDraw Solution Park.
Metabolic pathway symbols
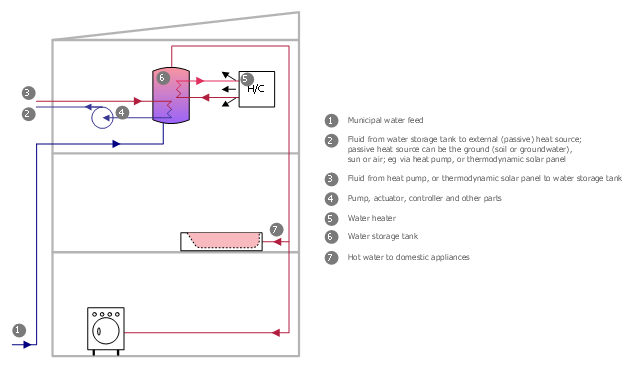
This plumbing and piping plan sample was designed on the base of the Wikimedia Commons file: Active Indirect Water Heater Diagram.svg.
[commons.wikimedia.org/ wiki/ File:Active_ Indirect_ Water_ Heater_ Diagram.svg]
This file is licensed under the Creative Commons Attribution-Share Alike 3.0 Unported license. [creativecommons.org/ licenses/ by-sa/ 3.0/ deed.en]
"Water heating is a thermodynamic process that uses an energy source to heat water above its initial temperature. Typical domestic uses of hot water include cooking, cleaning, bathing, and space heating. In industry, hot water and water heated to steam have many uses.
Domestically, water is traditionally heated in vessels known as water heaters, kettles, cauldrons, pots, or coppers. These metal vessels that heat a batch of water do not produce a continual supply of heated water at a preset temperature. Rarely, hot water occurs naturally, usually from natural hot springs. The temperature varies based on the consumption rate, becoming cooler as flow increases.
Appliances that provide a continual supply of hot water are called water heaters, hot water heaters, hot water tanks, boilers, heat exchangers, geysers, or calorifiers. These names depend on region, and whether they heat potable or non-potable water, are in domestic or industrial use, and their energy source. In domestic installations, potable water heated for uses other than space heating is also called domestic hot water (DHW).
Fossil fuels (natural gas, liquefied petroleum gas, oil), or solid fuels are commonly used for heating water. These may be consumed directly or may produce electricity that, in turn, heats water. Electricity to heat water may also come from any other electrical source, such as nuclear power or renewable energy. Alternative energy such as solar energy, heat pumps, hot water heat recycling, and geothermal heating can also heat water, often in combination with backup systems powered by fossil fuels or electricity." [Water heating. Wikipedia]
The plumbing plan example "Active indirect water heater diagram" was created using the ConceptDraw PRO diagramming and vector drawing software extended with the Plumbing and Piping Plans solution from the Building Plans area of ConceptDraw Solution Park.
Plumbing and piping plan
This arrow loop cycle diagram sample was created on the base of the figure illustrating the webpage "Exploratory Advanced Research Program Hand-Off Workshops" from the US Department of Transportation - Federal Highway Administration (FHWA) website. "The FHWA’s research and technology innovation life cycle illustrates that research and technology development are not insular activities, but integrated processes that together constitute a system.
Following general workshop discussion, a number of common issues emerged among the groups. These centered around the research life cycle, communicating the value of exploratory advanced research, and continued project funding. It was felt that there is a general need to better describe the research and deployment cycle specific to highway transportation and possibly to highway research fields, such as materials or system planning. Research life cycle diagrams show a very linear, chronological process but it is not necessarily that way in reality." [fhwa.dot.gov/ advancedresearch/ pubs/ 11034/ ]
The arrow loop diagram example "Innovation life cycle" was created using the ConceptDraw PRO diagramming and vector drawing software extended with the Target and Circular Diagrams solution from the Marketing area of ConceptDraw Solution Park.
www.conceptdraw.com/ solution-park/ marketing-target-and-circular-diagrams
Arrow loop cycle diagram
This circular arrows diagram sample shows the systems development life cycle (SDLC) stages.
"The systems development life cycle (SDLC), also referred to as the application development life-cycle, is a term used in systems engineering, information systems and software engineering to describe a process for planning, creating, testing, and deploying an information system. The systems development life-cycle concept applies to a range of hardware and software configurations, as a system can be composed of hardware only, software only, or a combination of both." [Systems development life-cycle. Wikipedia]
The arrow circle diagram example "Systems development life cycle" was created using the ConceptDraw PRO diagramming and vector drawing software extended with the Circular Arrows Diagrams solution from the area "What is a Diagram" of ConceptDraw Solution Park.
Circular arrows diagram

This circular arrows diagram sample shows business process management life cycle.
It was designed on the base of the Wikimedia Commons file: Business Process Management Life-Cycle.svg. [commons.wikimedia.org/ wiki/ File:Business_ Process_ Management_ Life-Cycle.svg]
This file is licensed under the Creative Commons Attribution-Share Alike 3.0 Unported license. [creativecommons.org/ licenses/ by-sa/ 3.0/ deed.en]
"BPM life-cycle.
Business process management activities can be grouped into six categories: vision, design, modeling, execution, monitoring, and optimization.
Functions are designed around the strategic vision and goals of an organization. Each function is attached with a list of processes. Each functional head in an organization is responsible for certain sets of processes made up of tasks which are to be executed and reported as planned. Multiple processes are aggregated to function accomplishments and multiple functions are aggregated to achieve organizational goals." [Business process management. Wikipedia]
The arrow donut chart example "BPM life cycle" was created using the ConceptDraw PRO diagramming and vector drawing software extended with the Circular Arrows Diagrams solution from the area "What is a Diagram" of ConceptDraw Solution Park.
Circular arrows diagram

This arrow ring diagram sample was created on the base of the figure illustrating the webpage "Grant Life Cycle" from the Georgia College website. "Grant Life Cycle.
Define Opportunity: Funding opportunities can come from anywhere: databases, agency websites, professional publications or colleagues. GC subscribes to the database GRC. Federal grant opportunities can be found through Grants.gov.
Develop Proposal: Once an opportunity has been identified OGSP will do the following:
(1) Review the announcement for application requirements.
(2) Meet with the Principal Investigator (PI) to develop a project management plan.
(3) Work up a draft budget for PI approval.
(4) Complete the sponsor/ required forms and budget justification to be included in the application.
Submit & Negotiate: Applications can only be submitted by GC or the GC Foundation. Once internal approval has been received, designated staff in the appropriate office will submit the application on behalf of the PI and institution. If awarded, the GC or Foundation personnel will review and negotiate acceptable terms and conditions to GC, GC Fdn and/ or USG.
All of these are part of Pre-award services. ...
Award Setup: OGSP will review award documentation and assist all responsible parties with their roles and responsibilities during the grant. OGSP is available through the life of the award to provide support with any non-financial issues.
Manage Subawards: If subawards were identified at application, OGSP will issue the subaward using GC approved forms. If the need for a portion of the work to be completed by an outside entity is noted in the post-award phase, the Grants Compliance Manager will secure agency approval and then issue the subaward. OGSP will monitor the fiscal aspects of the subaward while the PI is responsible for the programmatic compliance.
Execute Project: OGSP continually monitors each grant for compliance with award terms & conditions. As legal representative, OGSP works with the PI and funder to expedite reports and resolve any issues that might arise.
Close Out Project: Once a grant has reached the end of the project period, all funders have requirements for final progress and financial reports. OGSP will work with the PI to make sure the progress report is submitted in a timely fashion and the Business & Finance completes the final invoices or report. The storage of the official project file is the responsibility of OGSP. All information and reports should be copied to the Grant Compliance Manager for inclusion in the official record." [gcsu.edu/ grants/ grantlifecycle.htm]
The arrow ring diagram example "Grant life cycle" was created using the ConceptDraw PRO diagramming and vector drawing software extended with the Target and Circular Diagrams solution from the Marketing area of ConceptDraw Solution Park.
www.conceptdraw.com/ solution-park/ marketing-target-and-circular-diagrams
Arrow ring diagram
- Water cycle diagram | Drawing Illustration | Drawing a Nature ...
- Water cycle diagram | Strategic planning - Cycle diagram | Research ...
- Water cycle diagram | Drawing a Nature Scene | Draw Flowcharts ...
- Water cycle diagram | | Fishbone Diagrams | Cloud Water Flow ...
- Water cycle diagram | Active indirect water heater diagram | Drawing ...
- Drawing a Nature Scene | Water cycle diagram | Pyramid Diagrams ...
- Water cycle diagram
- Water cycle diagram | Strategic planning - Cycle diagram | Strategic ...
- Water cycle diagram | Push Notification Lifecycle Overview | Target ...
- Water cycle diagram | Swim Lane Diagrams | Pie Chart Examples ...
- Water cycle diagram | Swim Lane Diagrams | Pie Chart Examples ...
- Drawing Illustration | Water cycle diagram | Drawing a Nature ...
- Water cycle diagram | Drawing a Nature Scene | Diagram Of H20 ...
- Water Cycle Pencil Diagram
- Water cycle diagram | Atmosphere air composition | EU greenhouse ...
- Water cycle diagram | Strategic planning - Cycle diagram | Drawing ...
- Water cycle diagram | Drawing a Nature Scene | Beauty in nature ...
- Water cycle diagram | Restaurant water supply | Active indirect water ...
- Water cycle diagram | Weather - Vector stencils library | Rain And ...
- Water cycle diagram | Draw Flowcharts with ConceptDraw | Drawing ...