This finance infographic sample was designed on the base of the webpage "Policy paper. International Climate Fund" on the UK Government website.
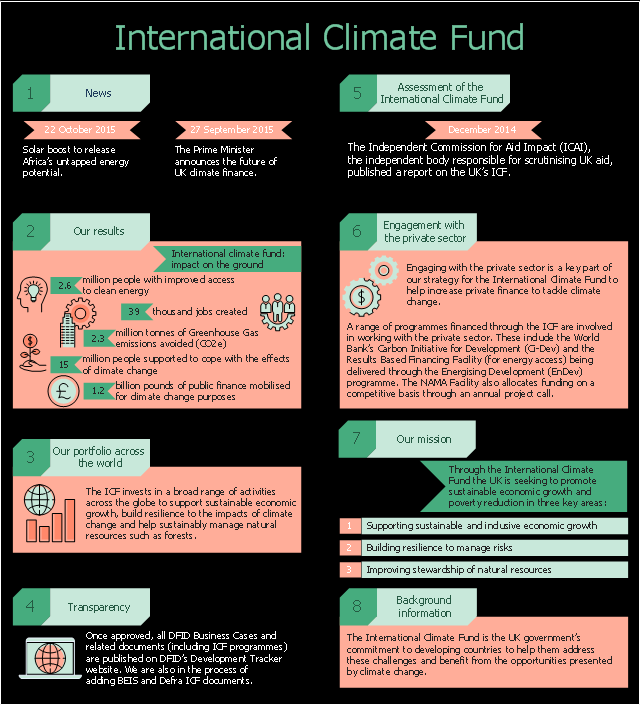
"The International Climate Fund (ICF) is the UK government’s commitment to developing countries to help them address the challenges presented by climate change and benefit from the opportunities." [gov.uk/ government/ publications/ international-climate-fund/ international-climate-fund]
Contains public sector information licensed under the Open Government Licence v3.0.
The finance infographic sample "International Climate Fund" was designed using ConceptDraw PRO software extended with Finanlial Infographics solution from Business Infographic area of ConceptDraw Solution Park.
Financial infogram
This flow chart sample was drawn on the base on the illustration of the article "Climate change impact on China food security in 2050" from the website of Chinese Academy of Agricultural Sciences .
[caas.cn/ en/ newsroom/ research_ update/ 67347.shtml]
"Food security is a condition related to the ongoing availability of food. ...
According to the Food and Agriculture Organization (FAO), food security "exists when all people, at all times, have physical and economic access to sufficient, safe and nutritious food to meet their dietary needs and food preferences for an active and healthy life". ...
Extreme events, such as droughts and floods, are forecast to increase as climate change takes hold. Ranging from overnight floods to gradually worsening droughts, these will have a range of impacts on the agricultural sector. ...
According to the Climate & Development Knowledge Network report Managing Climate Extremes and Disasters in the Agriculture Sectors: Lessons from the IPCC SREX Report, the impacts will include changing productivity and livelihood patterns, economic losses, and impacts on infrastructure, markets and food security. Food security in future will be linked to our ability to adapt agricultural systems to extreme events." [Food security. Wikipedia]
The flowchart example "Food security assessment" was created using the ConceptDraw PRO diagramming and vector drawing software extended with the Flowcharts solution from the area "What is a Diagram" of ConceptDraw Solution Park.
Flowchart

This DFD sample was created on the base of the figure from the NASA website. [asd-www.larc.nasa.gov/ ATBD/ DFD.html]
"Clouds and the Earth's Radiant Energy System (CERES).
EOS-Terra: Understanding Earth's Clouds and Climate.
The Clouds and the Earth's Radiant Energy System (CERES) instrument is one of several that will be flown aboard the Earth Observing System's Terra spacecraft, scheduled for launch in late1999. The data from the CERES instrument will be used to study the energy exchanged between the Sun; the Earth's atmosphere, surface and clouds; and outer space.
The CERES EOS-Terra instrument will be the second CERES instrument in Earth orbit. The first CERES instrument is currently orbiting the Earth aboard the Tropical Rainfall Measuring Mission observatory, which was launched in November 1997. Early results of the TRMM mission show that the first CERES has provided better measurement capabilities than any previous satellite instrument of its kind.
What CERES Will Measure.
CERES will measure the energy at the top of the atmosphere, as well as estimate energy levels in the atmosphere and at the Earth's surface. Using information from very high resolution cloud imaging instruments on the same spacecraft, CERES also will determine cloud properties, including cloud amount, altitude, thickness, and the size of the cloud particles. All of these measurements are critical for advancing our understanding of the Earth's total climate system and further improving climate prediction models.
The CERES instrument is based on NASA Langley's highly successful Earth Radiation Budget Experiment (ERBE) which used three satellites to provide global energy budget measurements from 1984 to 1990." [nasa.gov/ centers/ langley/ news/ factsheets/ CERES.html]
The DFD example "CERES data flow diagram" was created using the ConceptDraw PRO diagramming and vector drawing software extended with the Data Flow Diagrams solution from the Software Development area of ConceptDraw Solution Park.
DFD

The vector stencils library "Weather" contains 17 weather clipart images for drawing illustrations on climate to show cloudiness, air temperature, precipitation, wind.
"Weather is the state of the atmosphere, to the degree that it is hot or cold, wet or dry, calm or stormy, clear or cloudy. Most weather phenomena occur in the troposphere, just below the stratosphere. Weather generally refers to day-to-day temperature and precipitation activity, whereas climate is the term for the average atmospheric conditions over longer periods of time. When used without qualification, "weather", is generally understood to mean the weather of Earth.
Weather is driven by air pressure (temperature and moisture) differences between one place and another. These pressure and temperature differences can occur due to the sun angle at any particular spot, which varies by latitude from the tropics. The strong temperature contrast between polar and tropical air gives rise to the jet stream. Weather systems in the mid-latitudes, such as extratropical cyclones, are caused by instabilities of the jet stream flow. Because the Earth's axis is tilted relative to its orbital plane, sunlight is incident at different angles at different times of the year. On Earth's surface, temperatures usually range ±40°C (−40°F to 100°F) annually. Over thousands of years, changes in Earth's orbit affect the amount and distribution of solar energy received by the Earth and influence long-term climate and global climate change." [Weather. Wikipedia]
The clip art example "Weather - Vector stencils library" was created using the ConceptDraw PRO diagramming and vector drawing software extended with the Nature solution from the Illustration area of ConceptDraw Solution Park.
www.conceptdraw.com/ solution-park/ illustrations-nature
Sunny

Cloudy

Overcast

Snow

Rain

Lightning

Hot

Warm

Frost

Mist

Strong wind

Flood

Tsunami

Dew

Hoar-frost

Earthquake

Snowflake

Geo Map — USA — Oklahoma

Geo Map - Europe - Bosnia and Herzegovina

Geo Map — Europe — Germany

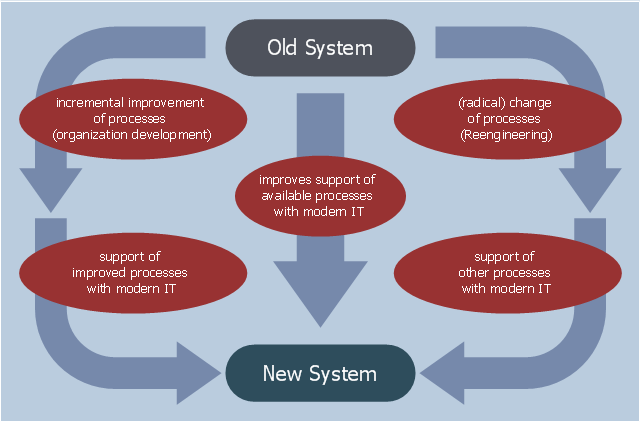
This example was designed on the base of the diagram "Organization Development vs. Business Process Reengineering" from the website of the Computer Science, Faculty 3, Bremen University. [informatik.uni-bremen.de/ gdpa/ part3/ p3gpo.htm]
"The efforts, behaviour, and performance of an employee in any organization for their growth is known as Organization development(OD).
Organization development (OD) is a field of research, theory and practice dedicated to expanding the knowledge and effectiveness of people to accomplish more successful organizational change and performance. ...
Key concepts of OD theory include: organizational climate (the mood or unique “personality” of an organization, which includes attitudes and beliefs that influence members’ collective behavior), organizational culture (the deeply-seated norms, values and behaviors that members share) and organizational strategies (how an organization identifies problems, plans action, negotiates change and evaluates progress)." [Organization development. Wikipedia]
The workflow diagram example "Organization Development vs. Business Process Reengineering" was created using ConceptDraw PRO software extended with the Business Process Workflow Diagrams solution from the Business Processes area of ConceptDraw Solution Park.
Workflow diagram
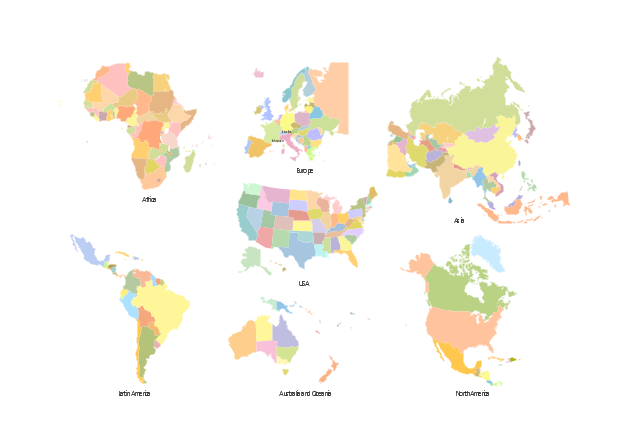
"A thematic map is a type of map or chart especially designed to show a particular theme connected with a specific geographic area. ...
A thematic map is a map that focuses on a specific theme or subject area, whereas in a general map the variety of phenomena - geological, geographical, political - regularly appear together. ...
Thematic maps emphasize spatial variation of one or a small number of geographic distributions. These distributions may be physical phenomena such as climate or human characteristics such as population density and health issues. ...
Thematic map are sometimes referred to as graphic essays that portray spatial variations and interrelationships of geographical distributions. Location, of course, is important to provide a reference base of where selected phenomena are occurring. ...
Thematic maps serve three primary purposes.
First, they provide specific information about particular locations.
Second, they provide general information about spatial patterns.
Third, they can be used to compare patterns on two or more maps." [Thematic map. Wikipedia]
The vector stencils library "Thematic maps" contains 7 continent map contours for creating the thematic maps of geographic regions displaying the metric values by countries, states and territories marked by different colors.
Use the design elements library "Thematic maps" to create spatial dashboards using the ConceptDraw PRO diagramming and vector drawing software for your Spatial Intelligence and Location Intelligence business practice.
The example "Design elements - Thematic maps" is included in the Spatial Dashboard solution from the area "What is a Dashboard" of ConceptDraw Solution Park.
Thematic map templates
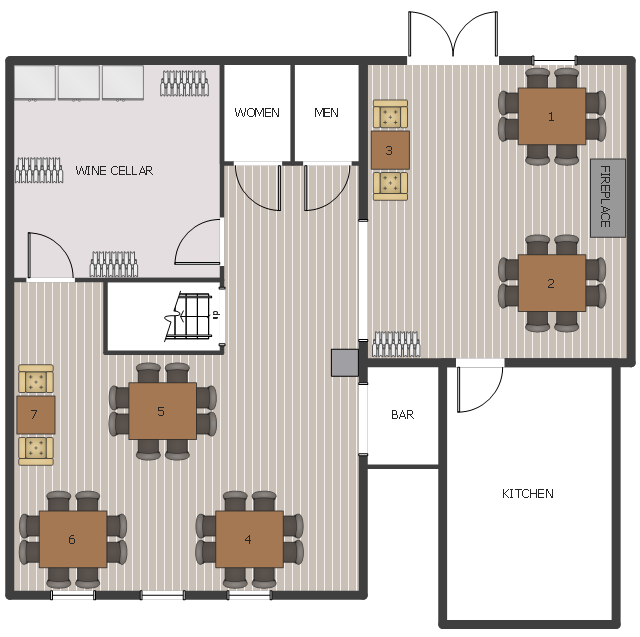
This floor plan sample shows wine cellar equipment and furniture layout.
"A wine cellar is a storage room for wine in bottles or barrels, or more rarely in carboys, amphorae, or plastic containers. In an active wine cellar, important factors such as temperature and humidity are maintained by a climate control system. In contrast, passive wine cellars are not climate-controlled, and are usually built underground to reduce temperature swings. An aboveground wine cellar is often called a wine room, while a small wine cellar (fewer than 500 bottles) is sometimes termed a wine closet. The household department responsible for the storage, care and service of wine in a great mediaeval house was termed the buttery." [Wine cellar. Wikipedia]
The equipment and furniture layout example "Wine Cellar Floor Plan" was created using the ConceptDraw PRO software extended with the Cafe and Restaurant solution from the Building Plans area of ConceptDraw Solution Park.
Equipment and furniture layout
Geo Map — USA — Washington

Total Quality Management

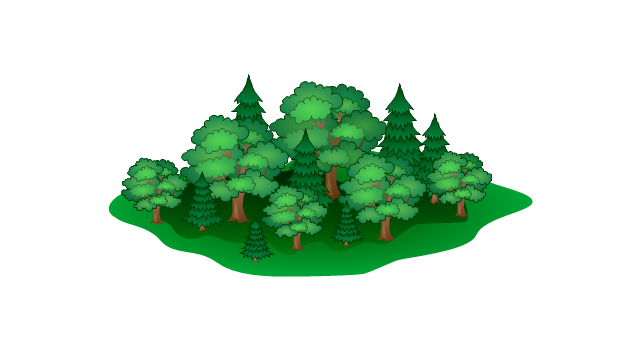
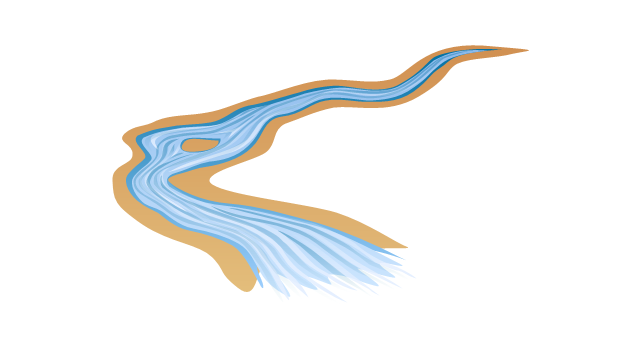
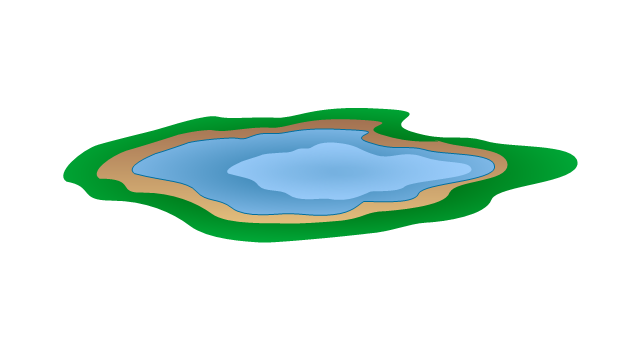
The vector stencils library "Geography" contains 14 clipart images of natural landscapes and water features for drawing illustrations.
"A natural landscape is a landscape that is unaffected by human activity. A natural landscape is intact when all living and nonliving elements are free to move and change. The nonliving elements distinguish a natural landscape from a wilderness. A wilderness includes areas within which natural processes operate without human interference, but a wilderness must contain life. As implied, a natural landscape may contain either the living or nonliving or both." [Natural landscape. Wikipedia]
The clip art example "Geography - Vector stencils library" was created using the ConceptDraw PRO diagramming and vector drawing software extended with the Nature solution from the Illustration area of ConceptDraw Solution Park.
www.conceptdraw.com/ solution-park/ illustrations-nature
Ocean

Forest
River
Lake
Waterfall

Mountains
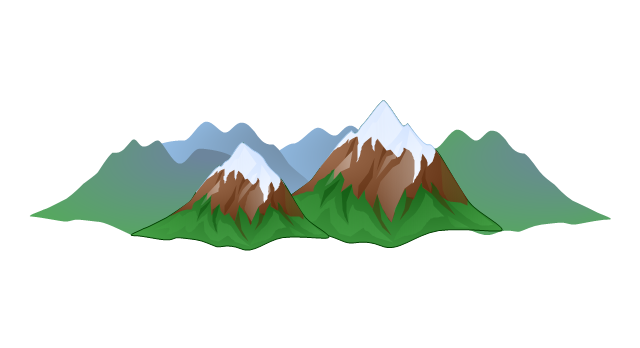
Mountain

Ravine
Volcano
Desert
Hills
Iceberg

Conifer tree
Tree

Geo Map - Europe - Latvia

Geo Map - Europe - Estonia

Geo Map - Africa - Rwanda

Geo Map - Africa - Sierra Leone

Map of Germany

Geo Map - Canada - Manitoba

Geo Map - Africa - Uganda

- Design elements - Weather | Draw Element Of Weather And Climate
- Total Quality Management Value | Fish Bone Diagram Climate ...
- Food security assessment - Flowchart | Flowcharts | Cross ...
- Water cycle diagram | Weather - Vector stencils library | Rain And ...
- Water cycle diagram | Weather - Vector stencils library | Weather ...
- Food security assessment - Flowchart | Flowcharts | Create ...
- Weather - Vector stencils library | How to Create Cisco Network ...
- Food security assessment - Flowchart | Agriculture Flowchart Draw
- Food security assessment - Flowchart | Flowcharts | Flowchart Of ...
- Food security assessment - Flowchart | How To Create Restaurant ...
- Design elements - Weather | How can you illustrate the weather ...
- Food security assessment - Flowchart | Flowcharts | ConceptDraw ...
- Food security assessment - Flowchart | Flowcharts | Contoh ...
- CERES data flow diagram | Chemistry Drawings | Educational ...
- Food security assessment - Flowchart | Flow chart Example ...
- CERES data flow diagram | Drawing a Nature Scene | Beauty in ...
- Nature Clipart and Illustrations | Design elements - Weather | How ...
- Earthquake disaster assessment - Workflow diagram | Weather ...
- Healthy Food Ideas | Food security assessment - Flowchart ...