Beauty in nature Illustrations and Clipart
|
ConceptDraw DIAGRAM is complex of the great-looking examples and templates of a nature illustration diagrams. Nature solution expands our software possibilities to create beautiful illustrations and clip arts with the new library which contains 17 vector objects. Users can export resulting diagram to PDF, PowerPoint, and other popular graphic formats. |

Pic.1 Hydrologic cycle diagram.
This diagram shows water movement in hydrosphere, atmosphere and below the Earth surface.
See also Samples:
TEN RELATED HOW TO's:
ConceptDraw DIAGRAM is the world’s premier cross-platform business-diagramming tool. Many, who are looking for an alternative to Visio, are pleasantly surprised with how well they can integrate ConceptDraw DIAGRAM into their existing processes. With tens of thousands of template objects, and an easy method for importing vital custom objects from existing Visio documents, ConceptDraw DIAGRAM is a powerful tool for making extremely detailed diagrams, quickly and easily.
Picture: ConceptDraw DIAGRAM : Able to Leap Tall Buildings in a Single Bound
Related Solution:
Using diagrams, you can visualize the flow of the information or build a detailed data structure. There's no need to have a degree in software and database design with ConceptDraw DIAGRAM , because this software has all the tools needed in developing models and diagrams. Project planning, designing and prototyping was never so easy.
This UML diagrams can be used to visualize a model of the data base development process. A UML diagram shows a graphical view of a structure of software system: components and relationships.
Using Unified Modeling Language helps to depict logical and physical elements of a data base, visually represent requirements and sub-systems. UML diagrams allows developers to organize and predict critical issues, as well as collaborate data base information.
Picture: Software and Database Design with ConceptDraw DIAGRAM
Related Solution:
Cafe Decor is one of the most important components of cafe design. Just thanks to the cafe decor elements is created the unique warm atmosphere of the cafe which makes you come back there again and again. ConceptDraw DIAGRAM extended with Cafe and Restaurant Floor Plan solution can help you create Cafe Decor designs simply and fast.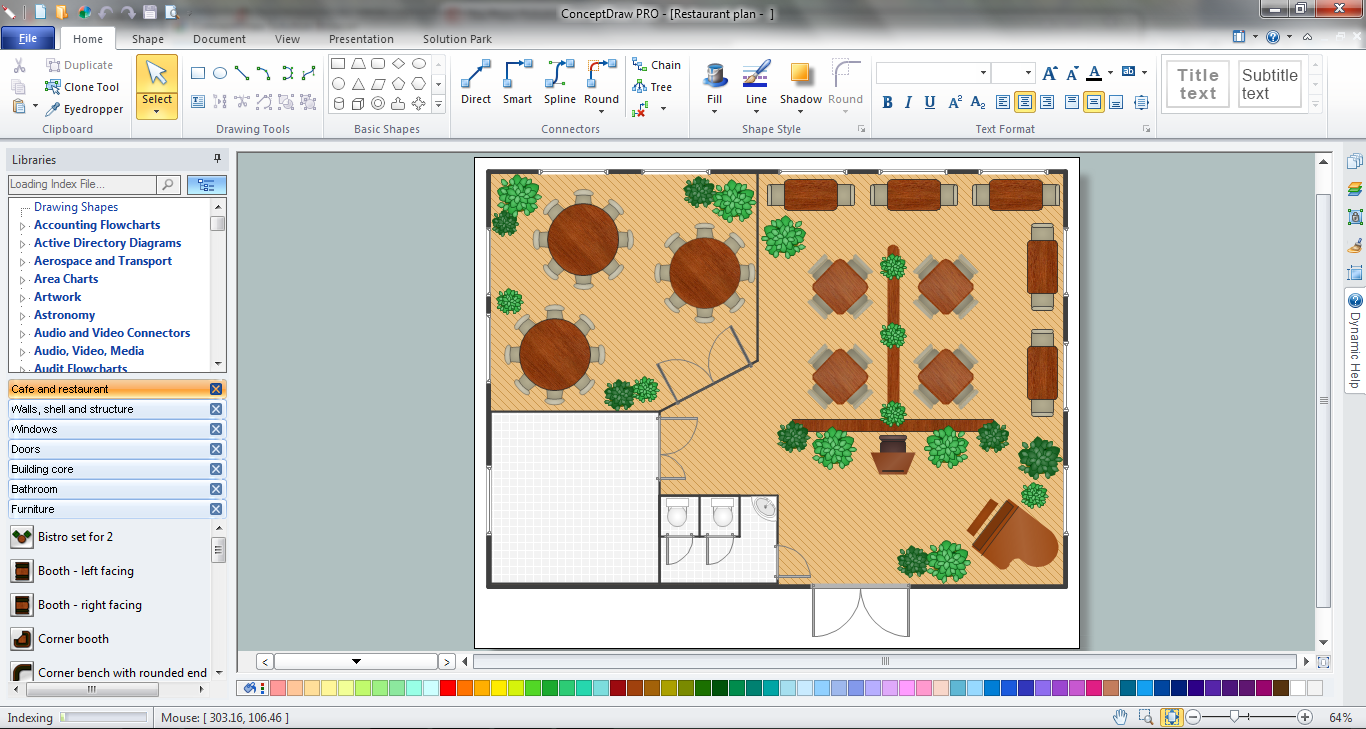
Picture: Cafe Decor
Related Solution:
ConceptDraw DIAGRAM diagramming and vector drawing software extended with Target and Circular Diagrams solution from the Marketing area of ConceptDraw Solution Park is a powerful tool for Daily Schedule Chart design.
Picture: Daily Schedule Chart
Related Solution:
Planning a water supply system is one of the stages of developing a building drawing. Although materials are constantly improved, design elements for plumbing haven't changed sufficiently for decades. This is due to necessity of maintaining very old systems.
The plan and schematic drawing of plumbing equipment, water pipe junctions and, kitchen facilities a is a rather significant element of a building plan. The suite of 4 vector libraries supplied with ConceptDraw solution for Plumbing and Piping Planning includes near 130 vector images of pipes, boilers, water pipe junctions, tanks and other plumbing devices, helpful when creating plumbing and piping plans, and blueprints of sewerage or water supply systems.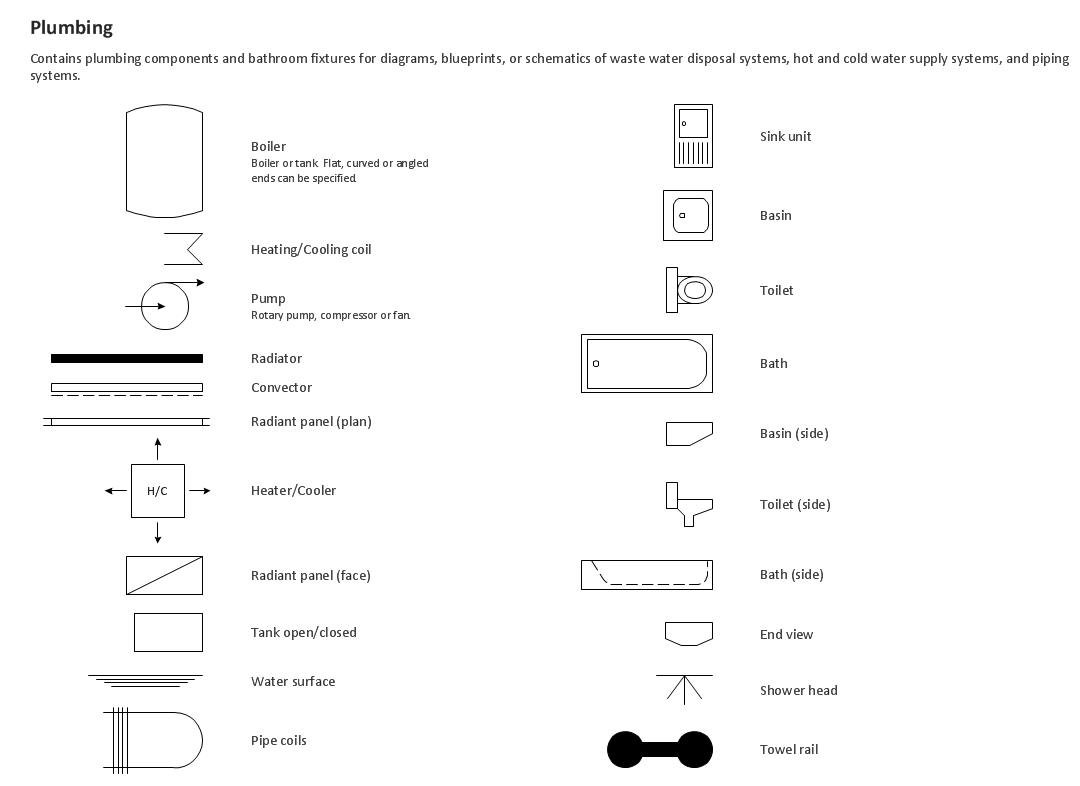
Picture: Building Drawing. Design Element — Plumbing
Related Solution:
Big and complex projects sometimes need some simplification of plans and schedules. That's why Program Evaluation and Review Technique was invented and first implemented in 1958. You can create PERT diagrams effortlessly with ConceptDraw DIAGRAM and share them with your colleagues.
Program Evaluation Review Technique (PERT) is a method that is used to assess and analyze projects. PERT is a valuable tool for the project management practice. PERT gives an assessment and analysis of the time needed to the project completion. A PERT chart is a visual tool that delivers a graphical view of a project timeline. It is used to display the sequences and dependences of project tasks necessary to complete a project. ConceptDraw DIAGRAM delivers the possibility to build a PERT along with other diagrams applied to assist management process by using its Seven Management and Planning Tools solution.
Picture: Program Evaluation and Review Technique (PERT) with ConceptDraw DIAGRAM
Related Solution:
You need design Electrical Schematic and dream to find the useful tools to draw it quick and easy? ConceptDraw DIAGRAM offers the unique Electrical Engineering Solution from the Industrial Engineering Area which will effectively help you!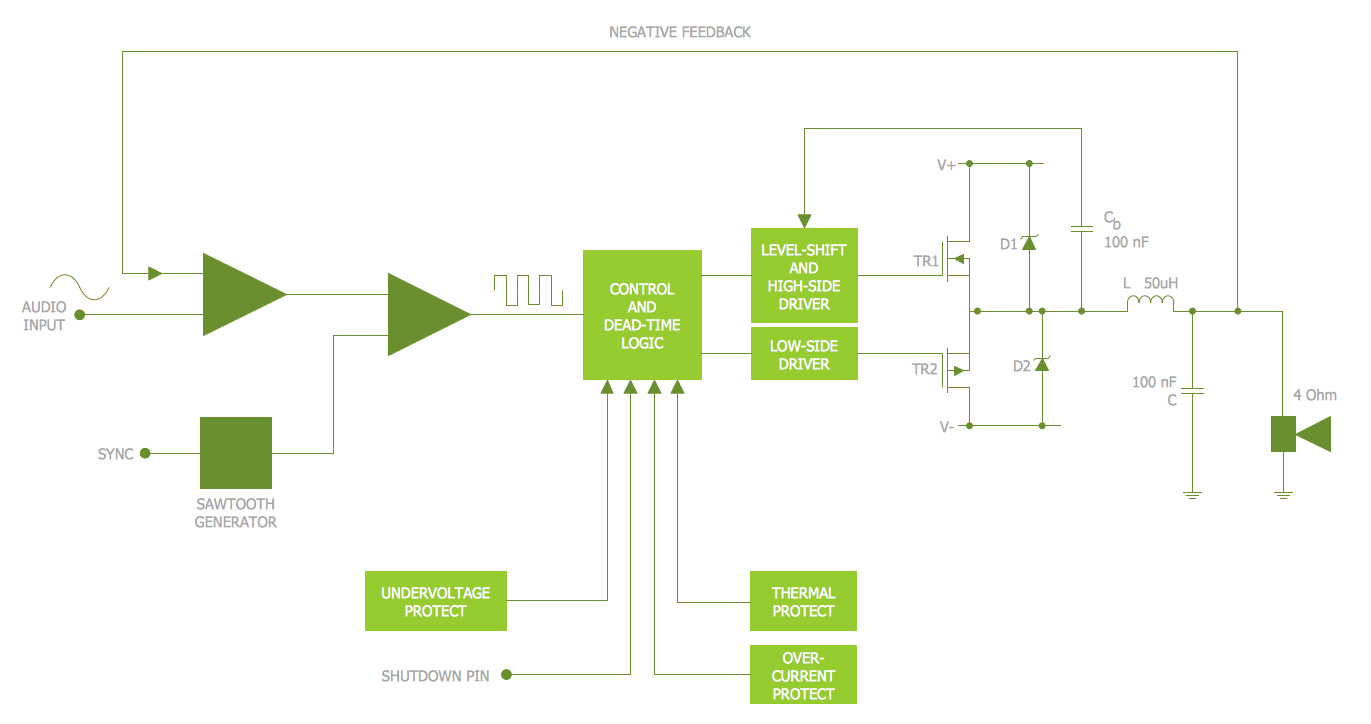
Picture: Electrical Schematic
Related Solution:
Now it’s easy to share your visual documents with other people in a form most convenient for them.
ConceptDraw DIAGRAM can save your drawings and diagrams in a number of highly useful formats, including graphic files. You can save your drawing as a.PNG,.JPG, or other graphic format file.
Picture: Export from ConceptDraw DIAGRAM Document to a Graphic File
Creation of well thought-out network security model will effectively help you in realization your network's security. ConceptDraw DIAGRAM diagramming and vector drawing software extended with Network Security Diagrams Solution from the Computer and Networks Area of ConceptDraw Solution Park lets fast and easy design all variety of network security models: Open network security model, Closed network security model, Restrictive network access model.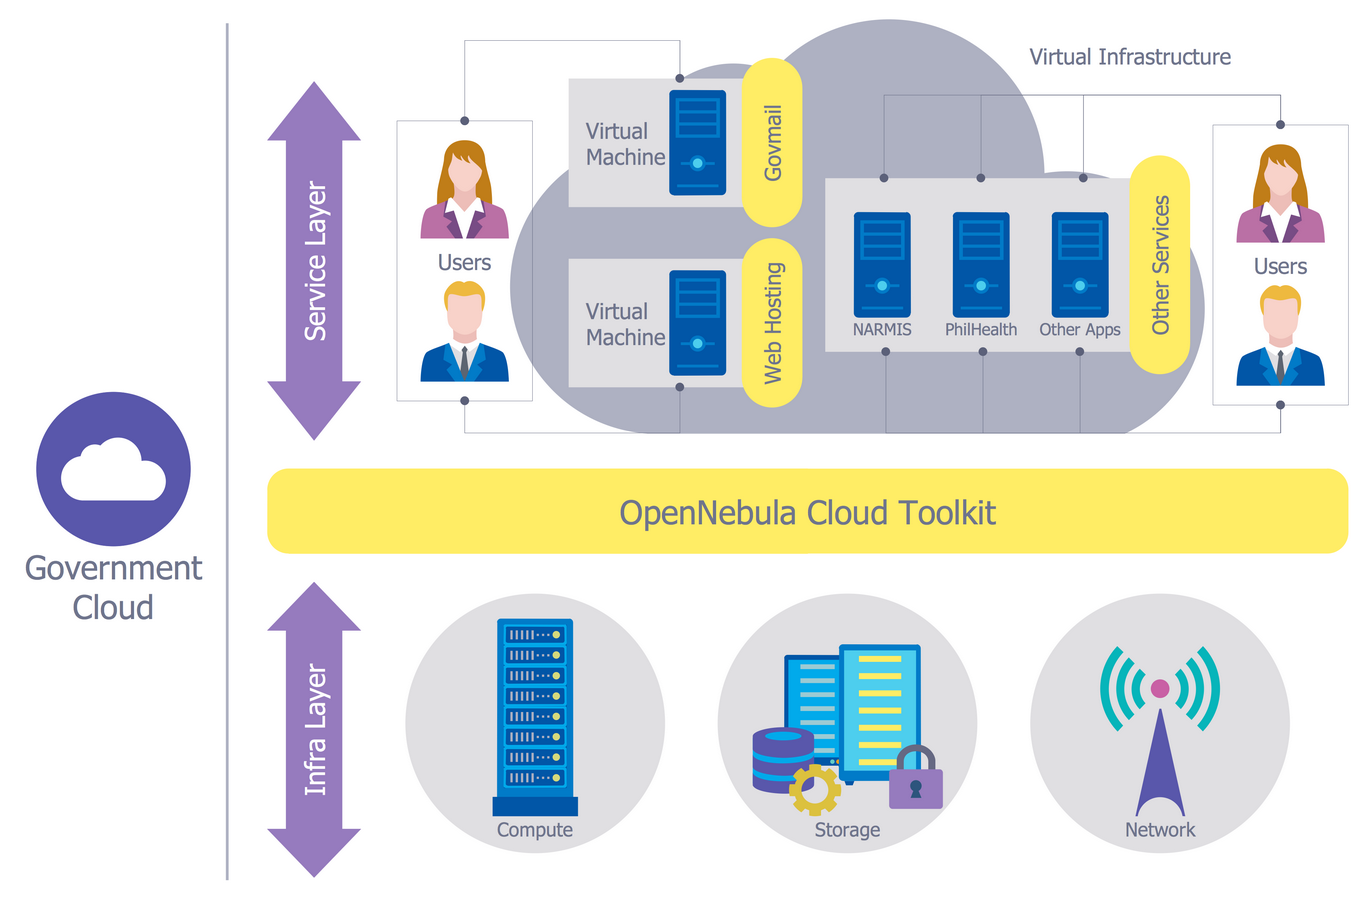
Picture: Network Security Model
Related Solution:
Food Art →
Food courts are very popular places. You want to increase attendance, advertise and invite attention to your food court? Make interesting design and create pictorial and bright food art posters and signboards, and don't forget to decorate your menu with images of tasty treats!
ConceptDraw DIAGRAM diagramming and vector software supplied with Food Court solution from the Food and Beverage area of ConceptDraw Solution Park offers powerful drawing tools for effective food art.
Picture: Food Art
Related Solution:
ConceptDraw
DIAGRAM 18