 PM Planning
This solution extends ConceptDraw MINDMAP and ConceptDraw Project software, allowing you to automatically create documents that reflect a project's status, for people who have different project roles.
Pyramid Diagram

 PM Teams
This solution extends ConceptDraw Office 2.0 products with a single information space for messaging to teams.
What Constitutes a Project?


 PM Easy
This solution extends ConceptDraw PROJECT software with the ability to quickly start a project; it lists task relationships and dependencies to make iterative planning easy.
How To Plan and Implement Projects Faster

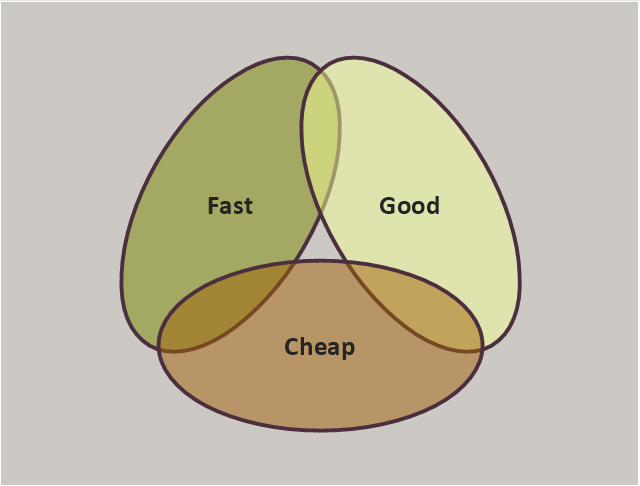
"You are given the options of Fast, Good and Cheap, and told to pick any two. Here Fast refers to the time required to deliver the product, Good is the quality of the final product, and Cheap refers to the total cost of designing and building the product. This triangle reflects the fact that the three properties of a project are interrelated, and it is not possible to optimize all three – one will always suffer."
[Project management triangle. Wikipedia]
A Venn-diagram style chart of the "project triangle" showing visually the potential overlaps between speed, quality and low cost, along with the "inability" to accomplish all three.
The diagram example "Project triangle chart" was redesigned using the ConceptDraw PRO diagramming and vector drawing software from Wikimedia Commons file Project-triangle.svg. [commons.wikimedia.org/ wiki/ File:Project-triangle.svg]
This file is made available under the Creative Commons CC0 1.0 Universal Public Domain Dedication. [creativecommons.org/ publicdomain/ zero/ 1.0/ deed.en]
The triangular chart sample "Project triangle chart" is included in the Pyramid Diagrams solution from the Marketing area of ConceptDraw Solution Park.
Triangular diagram
How to Create Presentation of Your Project Gantt Chart

Gantt Chart Software

How to Report Task's Execution with Gantt Chart

"A project network is a graph (flow chart) depicting the sequence in which a project's terminal elements are to be completed by showing terminal elements and their dependencies.
... the project network shows the "before-after" relations.
The most popular form of project network is activity on node, the other one is activity on arrow.
The condition for a valid project network is that it doesn't contain any circular references." [Project network. Wikipedia]
The PERT chart example "Project management plan" was created using the ConceptDraw PRO diagramming and vector drawing software extended with the solution "Seven Management and Planning Tools" from the Management area of ConceptDraw Solution Park.
PERT

Legend

How to Create Gantt Chart

Product Overview

Gant Chart in Project Management

What is Gantt Chart (historical reference)

Gantt charts for planning and scheduling projects

Gantt chart examples

The PERT chart shows the logical connections and consequence of a set of tasks. PERT charts the time period for problem solving and the implementation plan for all activities along the critical path. The PERT chart is also known as a precedence diagram or project network diagram.
"The Program (or Project) Evaluation and Review Technique, commonly abbreviated PERT, is a statistical tool, used in project management, that is designed to analyze and represent the tasks involved in completing a given project. ...
PERT is a method to analyze the involved tasks in completing a given project, especially the time needed to complete each task, and to identify the minimum time needed to complete the total project.
PERT was developed primarily to simplify the planning and scheduling of large and complex projects. ...
A network diagram can be created by hand or by using diagram software. There are two types of network diagrams, activity on arrow (AOA) and activity on node (AON). Activity on node diagrams are generally easier to create and interpret." [Program Evaluation and Review Technique. Wikipedia]
The PERT chart is one of the Seven Management and Planning Tools (7 MP tools, Seven New Quality Tools).
The PERT chart template for the ConceptDraw PRO diagramming and vector drawing software is included in the solution "Seven Management and Planning Tools" from the Management area of ConceptDraw Solution Park.
PERT chart template

Legend

- PM Teams | Monthly calendar template | PM Easy |
- Business calendar example | Monthly calendar template | PM ...
- Examples of Flowcharts, Org Charts and More | Business calendar ...
- Project timeline - Request for proposal plan | PERT chart - Request ...
- Design elements - Calendars | Business diagrams & Org Charts with ...
- Project Calendar
- Conceptdraw.com: Mind Map Software, Drawing Tools | Project ...
- Calendar template | Design elements - Calendars | PM Teams |
- Pyramid Diagram | Diagram Flow Chart | How To Plan and ...
- Gantt charts for planning and scheduling projects | Gant Chart in ...
- Gant Chart in Project Management | Gantt charts for planning and ...
- Pyramid Diagram | Gantt charts for planning and scheduling projects ...
- Audit flowchart - Project management process | Good Flow Chart ...
- Project timeline diagram - New business project plan | How To Plan ...
- Timeline diagram - Project schedule | How to Report Task's ...
- Business diagrams & Org Charts with ConceptDraw PRO
- Gantt charts for planning and scheduling projects | Gant Chart in ...
- Flowchart Programming Project . Flowchart Examples | Business ...
- Project timeline diagram - New business project plan | Timeline ...
- Program to Make Flow Chart
- ERD | Entity Relationship Diagrams, ERD Software for Mac and Win
- Flowchart | Basic Flowchart Symbols and Meaning
- Flowchart | Flowchart Design - Symbols, Shapes, Stencils and Icons
- Flowchart | Flow Chart Symbols
- Electrical | Electrical Drawing - Wiring and Circuits Schematics
- Flowchart | Common Flowchart Symbols
- Flowchart | Common Flowchart Symbols