WBS Diagram

How to Report Task's Execution with Gantt Chart

ConceptDraw Arrows10 Technology

Org Chart Diagram


"Project planning is part of project management, which relates to the use of schedules such as Gantt charts to plan and subsequently report progress within the project environment.
Initially, the project scope is defined and the appropriate methods for completing the project are determined. Following this step, the durations for the various tasks necessary to complete the work are listed and grouped into a work breakdown structure. Project planning is often used to organize different areas of a project, including project plans, work loads and the management of teams and individuals. The logical dependencies between tasks are defined using an activity network diagram that enables identification of the critical path. Float or slack time in the schedule can be calculated using project management software. Then the necessary resources can be estimated and costs for each activity can be allocated to each resource, giving the total project cost. At this stage, the project schedule may be optimized to achieve the appropriate balance between resource usage and project duration to comply with the project objectives. Once established and agreed, the project schedule becomes what is known as the baseline schedule. Progress will be measured against the baseline schedule throughout the life of the project. Analyzing progress compared to the baseline schedule is known as earned value management.
The inputs of the project planning phase include the project charter and the concept proposal. The outputs of the project planning phase include the project requirements, the project schedule, and the project management plan." [Project planning. Wikipedia]
The flow chart example "Project planning process" was created using the ConceptDraw PRO diagramming and vector drawing software extended with the Flowcharts solution from the area "What is a Diagram" of ConceptDraw Solution Park.
Flowchart - Project planning process

Why People Select ConceptDraw MINDMAP

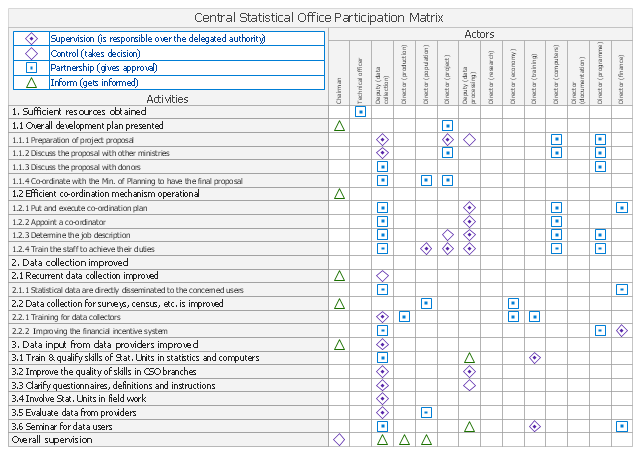
"A responsibility assignment matrix (RAM), also known as RACI matrix or ARCI matrix or linear responsibility chart (LRC), describes the participation by various roles in completing tasks or deliverables for a project or business process. It is especially useful in clarifying roles and responsibilities in cross-functional/ departmental projects and processes.
RACI and ARCI are acronyms derived from the four key responsibilities most typically used: Responsible, Accountable, Consulted, and Informed. ...
The matrix is typically created with a vertical axis (left-hand column) of tasks (e.g., from a work breakdown structure WBS) or deliverables (e.g., from a product breakdown structure PBS), and a horizontal axis (top row) of roles (e.g., from an organizational chart)" [Responsibility assignment matrix. Wikipedia]
The responsibility assignment matrix example "Central statistical office" was created using the ConceptDraw PRO diagramming and vector drawing software extended with the solution "Seven Management and Planning Tools" from the Management area of ConceptDraw Solution Park.
Involvement matrix
- WBS Diagram | ConceptDraw Arrows10 Technology | Product ...
- WBS Diagram | How to Report Task's Execution with Gantt Chart ...
- WBS Diagram | PM Easy | How to Report Task's Execution with ...
- WBS Diagram | Product Overview | PM Easy | Wbs
- Mindmap Project Management Wbs Diagram
- Project planning process - Flowchart | Top 5 Android Flow Chart ...
- UML Use Case Diagram Example Social Networking Sites Project ...
- | Timeline diagram - Project schedule | How To Create Onion ...
- Product Overview | PM Easy | WBS Diagram | Draw Project Wbs
- Pyramid Diagram | Project management life cycle - Flowchart | How ...
- Diagram Of Project Charter
- Wbs Diagram Park
- Gantt chart examples | Gant Chart in Project Management | Gantt ...
- Product Overview | WBS Diagram | How to Report Task's Execution ...
- PM Easy | How to Report Task's Execution with Gantt Chart ...
- Wbs Project Creation
- Wbs And Gantt Chart For Metro Project
- | Project — Working With Tasks | How to Report Task's Execution ...
- Product Overview | PM Easy | Example Wbs For Computer System