Pyramid Diagram

Software Work Flow Process in Project Management with Diagram

This sample shows the Workflow Diagram that clearly illustrates stages a BPM consists of and relations between all parts of business. The Workflow Diagrams are used to represent the transferring of data during the work process, to study and analysis the working processes, and to optimize a workflow.
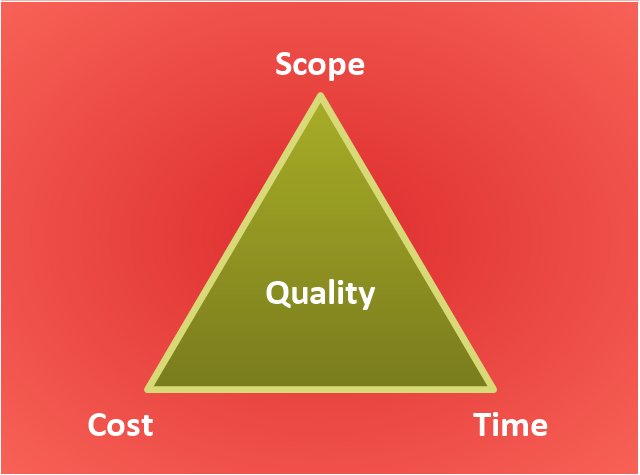
"The Project Management Triangle (called also Triple Constraint or the Iron Triangle) is a model of the constraints of project management. It is a graphic aid where the three attributes show on the corners of the triangle to show opposition. It is useful to help with intentionally choosing project biases, or analyzing the goals of a project. It is used to illustrate that project management success is measured by the project team's ability to manage the project, so that the expected results are produced while managing time and cost." [Project management triangle. Wikipedia]
The pyramid chart example "Project management triangle diagram" was redesigned using the ConceptDraw PRO diagramming and vector drawing software from Wikimedia Commons file Project-triangle-en.svg. [commons.wikimedia.org/ wiki/ File:Project-triangle-en.svg]
The project management triangle chart example is included in the Pyramid Diagrams solution from the Marketing area of ConceptDraw Solution Park.
Pyramid diagram
ConceptDraw PROJECT Project Management Software Tool

Project — Assigning Resources


How To Create Project Report

Program to Make Flow Chart

Entity Relationship Diagram Symbols

CORRECTIVE ACTIONS PLANNING. Risk Diagram (PDPC)


- Project Management Structure Diagram
- Block Diagram Of Project Management
- Software Project Management Uml Diagrams
- Class Diagram For Project Management System
- Venn Diagrams | Project Management Venn Diagram
- Diagram Of It Project Management
- Bar Diagrams for Problem Solving. Create event management bar ...
- Software Work Flow Process in Project Management with Diagram ...
- Green Project Management Diagrams