Pyramid Diagram

Software Work Flow Process in Project Management with Diagram

This sample shows the Workflow Diagram that clearly illustrates stages a BPM consists of and relations between all parts of business. The Workflow Diagrams are used to represent the transferring of data during the work process, to study and analysis the working processes, and to optimize a workflow.
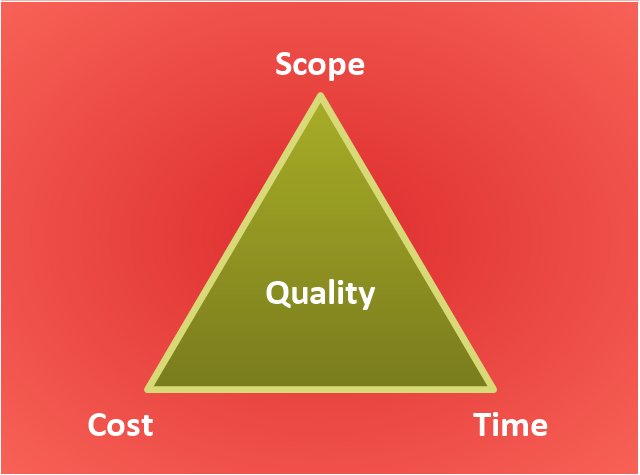
"The Project Management Triangle (called also Triple Constraint or the Iron Triangle) is a model of the constraints of project management. It is a graphic aid where the three attributes show on the corners of the triangle to show opposition. It is useful to help with intentionally choosing project biases, or analyzing the goals of a project. It is used to illustrate that project management success is measured by the project team's ability to manage the project, so that the expected results are produced while managing time and cost." [Project management triangle. Wikipedia]
The pyramid chart example "Project management triangle diagram" was redesigned using the ConceptDraw PRO diagramming and vector drawing software from Wikimedia Commons file Project-triangle-en.svg. [commons.wikimedia.org/ wiki/ File:Project-triangle-en.svg]
The project management triangle chart example is included in the Pyramid Diagrams solution from the Marketing area of ConceptDraw Solution Park.
Pyramid diagram
HelpDesk
How to Create Project Diagrams on Mac

Process Flowchart


CORRECTIVE ACTIONS PLANNING. Risk Diagram (PDPC)
 - Health care")

"A project manager is the person responsible for accomplishing the stated project objectives. Key project management responsibilities include creating clear and attainable project objectives, building the project requirements, and managing the constraints of the project management triangle, which are cost, time, scope, and quality.
A project manager is often a client representative and has to determine and implement the exact needs of the client, based on knowledge of the firm they are representing. A project manager is the bridging gap between the production team and client. So he/ she must have a fair knowledge of the industry they are in so that they are capable of understanding and discussing the problems with either party. The ability to adapt to the various internal procedures of the contracting party, and to form close links with the nominated representatives, is essential in ensuring that the key issues of cost, time, quality and above all, client satisfaction, can be realized.
The term and title 'project manager' has come to be used generically to describe anyone given responsibility to complete a project. However, it is more properly used to describe a person with full responsibility and the same level of authority required to complete a project. If a person does not have high levels of both responsibility and authority then they are better described as a project administrator, coordinator, facilitator or expeditor." [Project manager. Wikipedia]
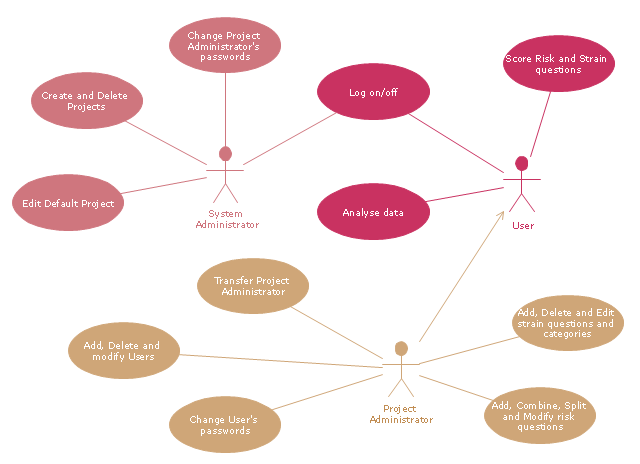
The UML use case diagram example "Project administrator" was created using the ConceptDraw PRO diagramming and vector drawing software extended with the Rapid UML solution from the Software Development area of ConceptDraw Solution Park.
A project manager is often a client representative and has to determine and implement the exact needs of the client, based on knowledge of the firm they are representing. A project manager is the bridging gap between the production team and client. So he/ she must have a fair knowledge of the industry they are in so that they are capable of understanding and discussing the problems with either party. The ability to adapt to the various internal procedures of the contracting party, and to form close links with the nominated representatives, is essential in ensuring that the key issues of cost, time, quality and above all, client satisfaction, can be realized.
The term and title 'project manager' has come to be used generically to describe anyone given responsibility to complete a project. However, it is more properly used to describe a person with full responsibility and the same level of authority required to complete a project. If a person does not have high levels of both responsibility and authority then they are better described as a project administrator, coordinator, facilitator or expeditor." [Project manager. Wikipedia]
The UML use case diagram example "Project administrator" was created using the ConceptDraw PRO diagramming and vector drawing software extended with the Rapid UML solution from the Software Development area of ConceptDraw Solution Park.
UML use case diagram
Activity on Node Network Diagramming Tool

Diagramming Software for Design UML Collaboration Diagrams


Project — Working With Tasks

How To Create Project Report

Affinity Diagram

ConceptDraw PROJECT Project Management Software Tool

Program to Make Flow Chart

Structured Systems Analysis and Design Method (SSADM) with ConceptDraw PRO

- Block Diagram Of Project Management
- Software Project Management Uml Diagrams
- Activities In A Project Management Software With Example Diagram
- Basic Flowchart Symbols and Meaning | Project management life ...
- What Is Activity Diagram In Project Management
- Project Management Structure Diagram
- Project management life cycle - Flowchart | Sample Project ...
- Project Management Diagram
- Tree Diagram For Project Planning
- Use Case Diagram For Client Project Management System
- Bar Diagrams for Problem Solving. Create event management bar ...
- Class Diagram For Project Management System
- Network Diagram Template For Project Management
- Project management life cycle - Flowchart | Program to Make Flow ...
- Network Diagram Template Project Management
- Software Work Flow Process in Project Management with Diagram ...
- Pert Diagram Example Project Management
- A Task Network Diagram In Soft Project Management
- ConceptDraw PROJECT Project Management Software Tool ...