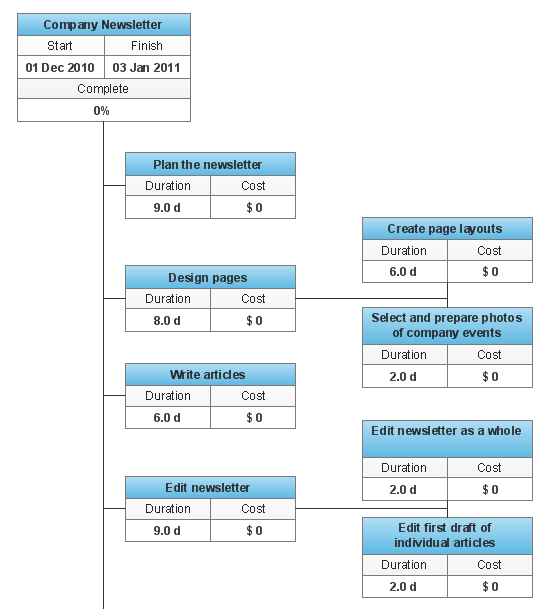
WBS Diagram
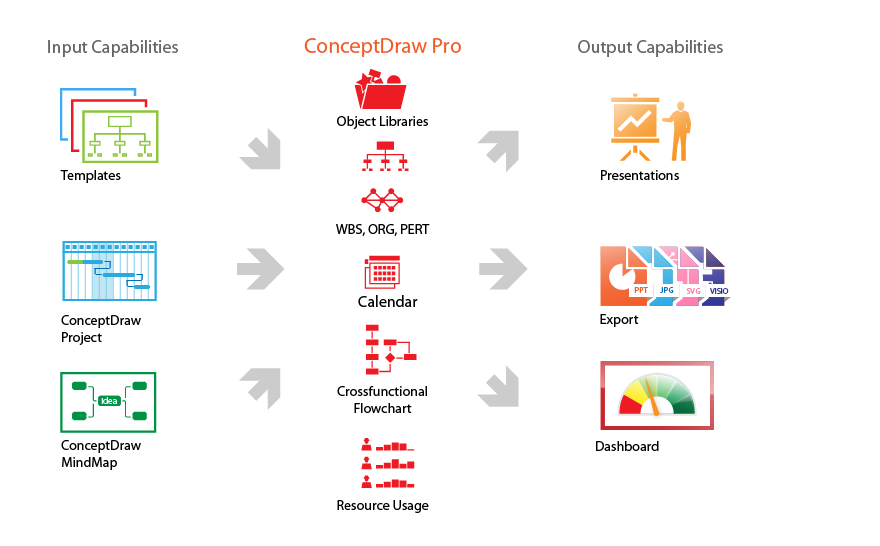
ConceptDraw Arrows10 Technology

How to Report Task's Execution with Gantt Chart

Org Chart Diagram

Product Overview
Social Media Response Management DFD Charts - software tools


 Flowcharts
The Flowcharts solution for ConceptDraw DIAGRAM is a comprehensive set of examples and samples in several varied color themes for professionals that need to represent graphically a process. Solution value is added by the basic flow chart template and shapes' libraries of flowchart notation. ConceptDraw DIAGRAM flow chart creator lets one depict the processes of any complexity and length, as well as design the Flowchart either vertically or horizontally.
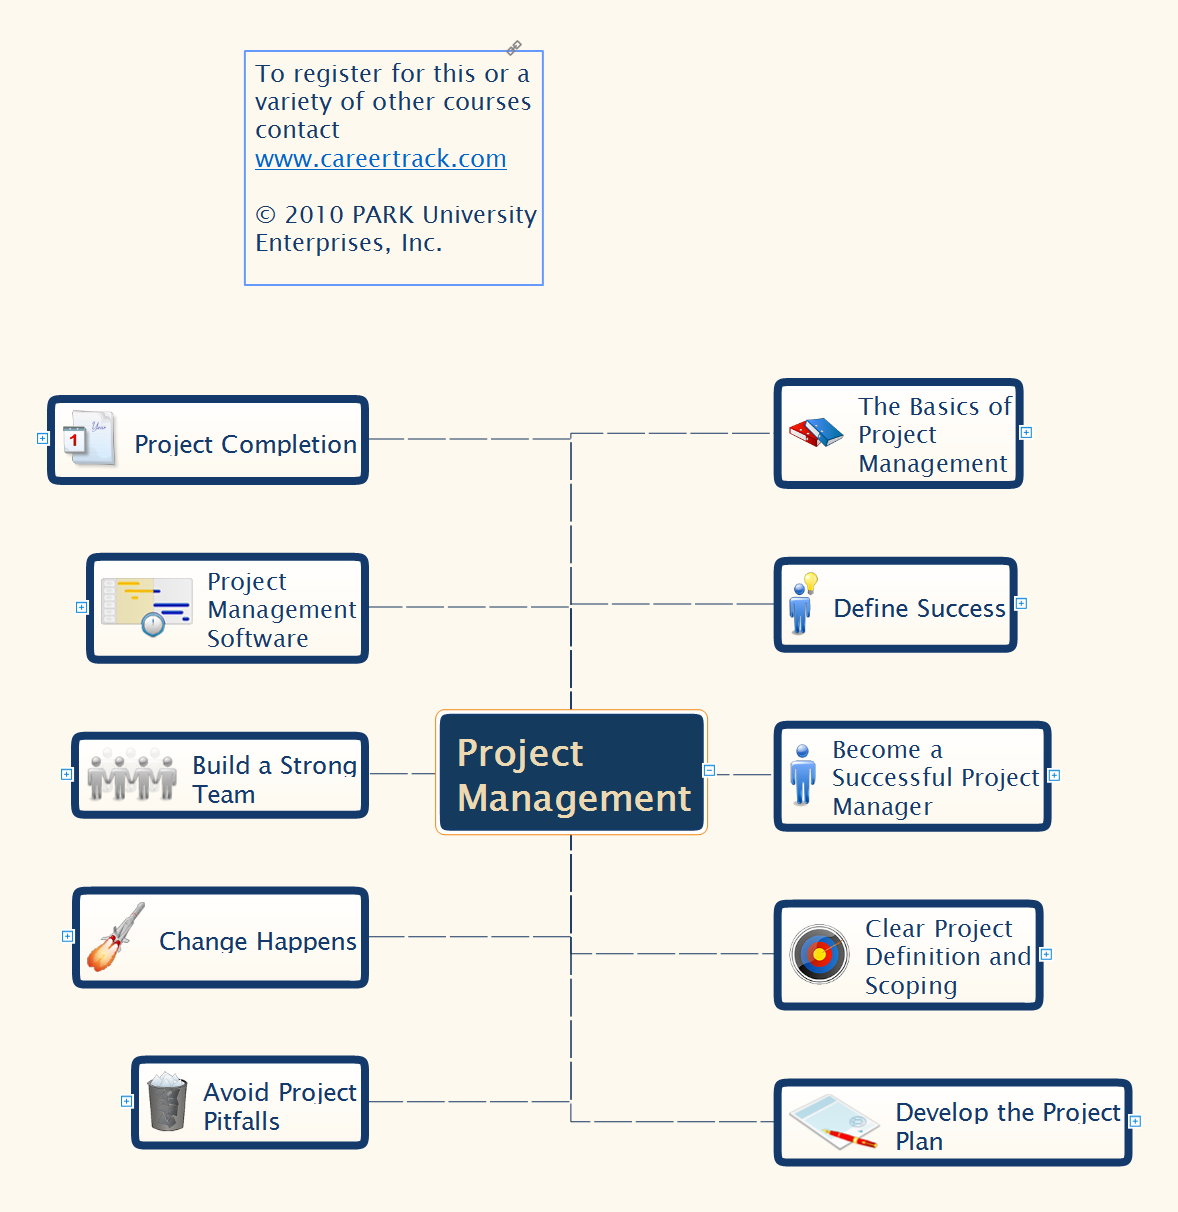
Project Management
Social Media Response DFD Flowcharts - diagramming software ( Mac PC )

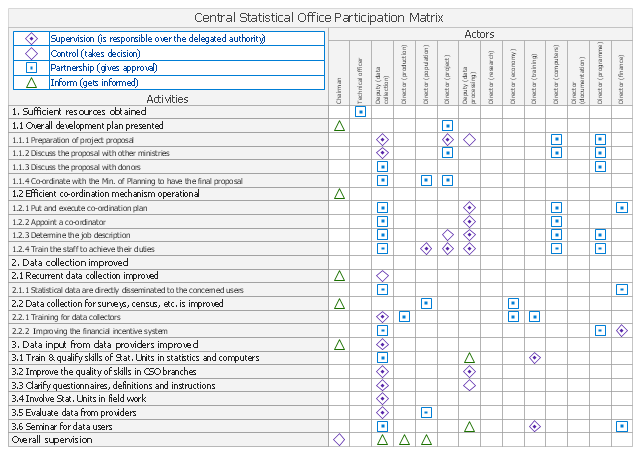
"A responsibility assignment matrix (RAM), also known as RACI matrix or ARCI matrix or linear responsibility chart (LRC), describes the participation by various roles in completing tasks or deliverables for a project or business process. It is especially useful in clarifying roles and responsibilities in cross-functional/ departmental projects and processes.
RACI and ARCI are acronyms derived from the four key responsibilities most typically used: Responsible, Accountable, Consulted, and Informed. ...
The matrix is typically created with a vertical axis (left-hand column) of tasks (e.g., from a work breakdown structure WBS) or deliverables (e.g., from a product breakdown structure PBS), and a horizontal axis (top row) of roles (e.g., from an organizational chart)" [Responsibility assignment matrix. Wikipedia]
The responsibility assignment matrix example "Central statistical office" was created using the ConceptDraw PRO diagramming and vector drawing software extended with the solution "Seven Management and Planning Tools" from the Management area of ConceptDraw Solution Park.
Involvement matrix
- Work Breakdown Structure Example
- Work Breakdown Structure Example Bathroom Renovation
- Example Of Wbs Diagram Project Management
- Wbs Example For Epc Projects
- Product Launch Wbs Chart
- WBS Diagram | PM Easy | How to Report Task's Execution with ...
- Epc Projects Wbs Templates
- | Flowcharts | Wbs Sample Product Launch
- PM Easy | Wbs Block Diagram