Pyramid Diagram
Inverted Pyramid
This inverted pyramid diagram of global liquidity shows world GDP and liquidity for 4 levels:
- Derivatives,
- Securitised debt,
- Broad money,
- Power money.
This triangular chart example is included in the Pyramid Diagrams solution from Marketing area of ConceptDraw Solution Park.

Example 1. Pyramid Diagram. Global liquidity inverted pyramid
This inverted triangle diagram was redesigned using ConceptDraw DIAGRAM diagramming and vector drawing software from Wikimedia Commons file The inverted pyramid of global liquidity.gif.
[commons.wikimedia.org/wiki/File:The_inverted_pyramid_of_global_liquidity.gif]
This file is licensed under the Creative Commons Attribution-Share Alike 3.0 Unported license. [creativecommons.org/licenses/by-sa/3.0/deed.en]
See more Pyramid Diagram:
TEN RELATED HOW TO's:
This sample shows the Business Report Pie Chart. The Pie Chart visualizes the data as the proportional parts of a whole, illustrates the numerical proportion. Pie Charts are very useful in the business, statistics, analytics, mass media.
Picture: Business Report Pie. Pie Chart Examples
Related Solution:
Draw Company Structure Diagram - get the detailed information about the company structure and hierarchy - who execute what tasks and who is in charge at this company. This information shows the reasoning and success of business and is indispensable for investors and financial institutions.
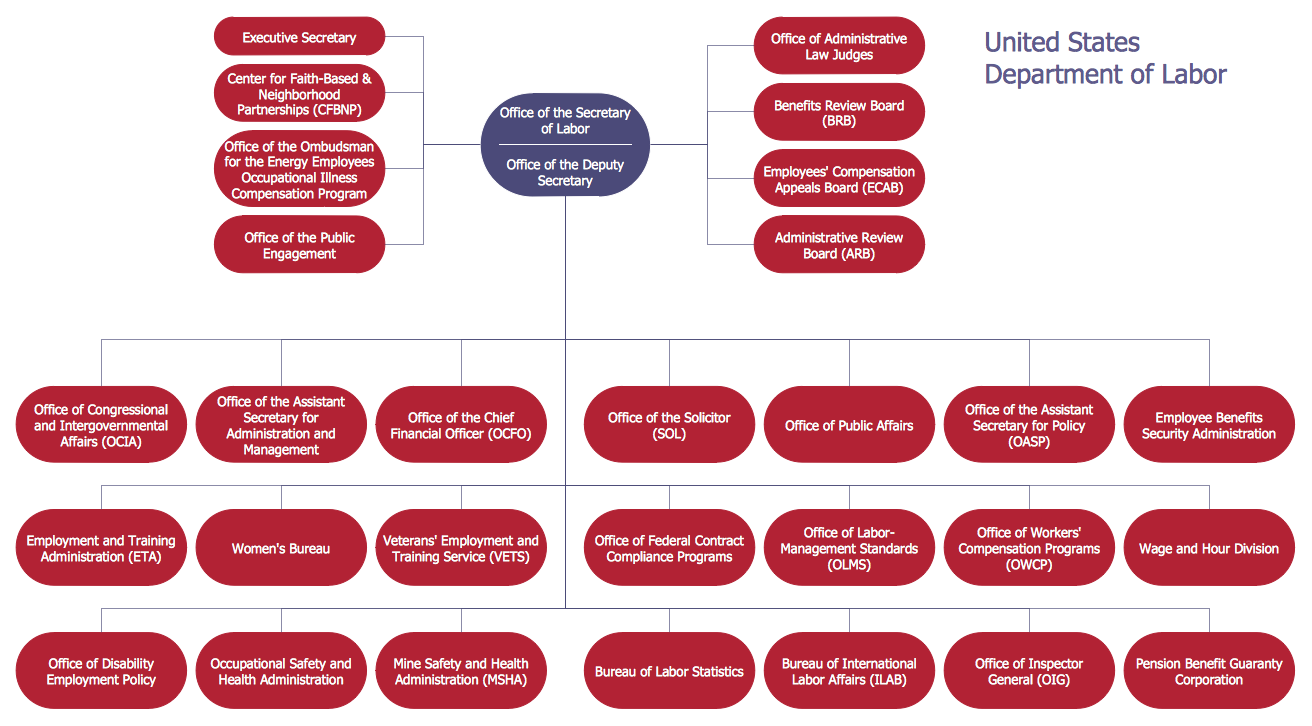
Picture: Draw Company Structure with Organization Charting Software
Related Solution:
Create bar charts for business management problem solving and data comparison using the ConceptDraw DIAGRAM diagramming and vector drawing software extended with the Bar Graphs Solution from the Graphs and Charts area of ConceptDraw Solition Park.
Picture: Bar Diagrams for Problem Solving.Create business management bar charts with Bar Graphs Solution
Related Solution:
Diagramming is an astonishing way to visualize business processes. The list of the most common business process flowchart symbols is quite long starting from basic flowcharts, continuing with SIPOC diagrams. Business process modeling was never easier than now, with special ConceptDraw Business Process Mapping solution.
To carry out all professional standard requirements for business processes mapping, it is necessarily to follow the special graphical notations. ConceptDraw Business Process Mapping solution offers an exhaustive suite of tools to aid business process mapping. There are three vector libraries SIPOC Diagrams, Business Process Flowcharts, and Swim Lanes that contains totally more than 50 symbols of standard BPM notations. This is all that professionals need to effectively evaluate and manage quality in business processes.
Picture: Business Process Flowchart Symbols
Related Solution:
This sample was created in ConceptDraw DIAGRAM diagramming and vector drawing software using the UML State Mashine Diagram library of the Rapid UML Solution from the Software Development area of ConceptDraw Solution Park.
This sample shows the work of the online store and can be used for the understanding of the online shopping processes, for projection and creating of the online store.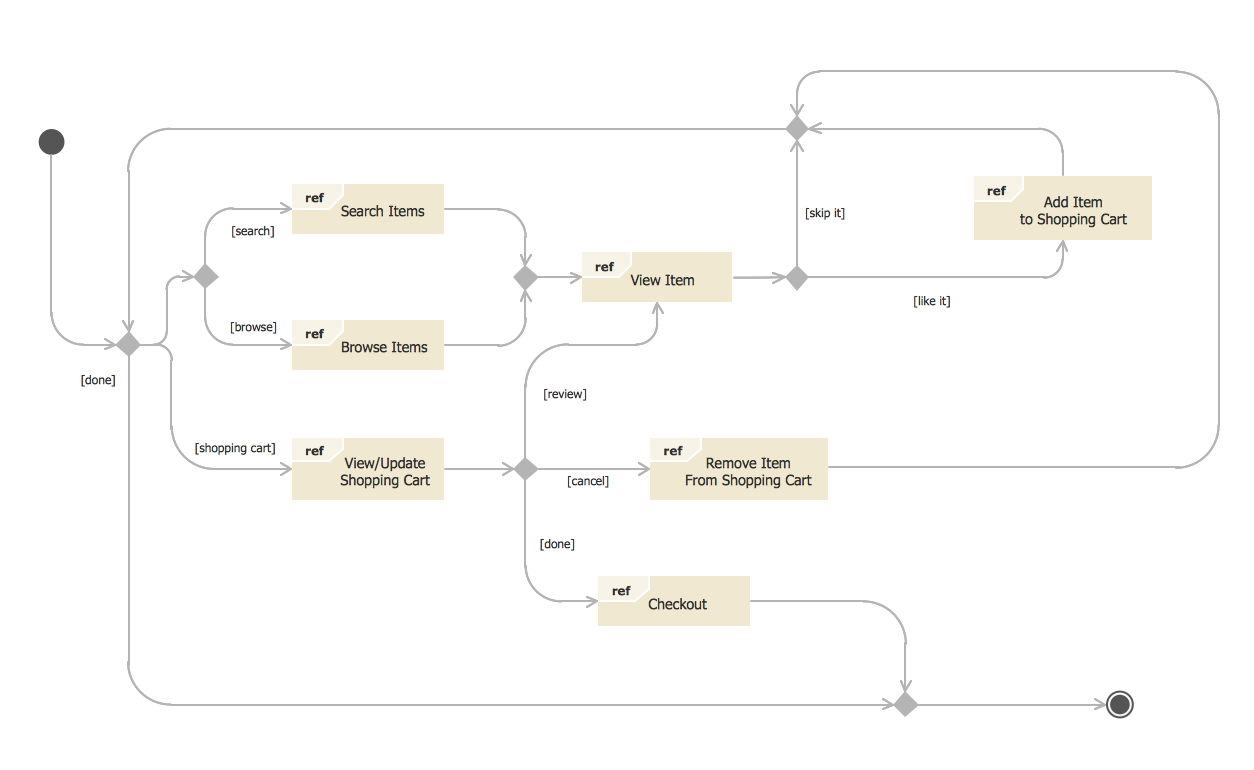
Picture: State Diagram Example — Online Store
Related Solution:
Easy charting software comes with beautiful chart templates and examples. This makes it easy to create professional charts without prior experience.
Graphs and Charts Area provide a wide collection of professional looking predesigned templates, samples and ready-to-use vector stencils that will help you to draw the charts and diagrams of various types: Pie Charts, Donut Charts, Line Charts, Column Charts, Bar Charts, Pyramids, Scatter Charts, Venn Diagrams, Spider Charts, Area Charts, Divided Bar Graphs.
Picture: Chart Software for Better Presentations
Related Solution:
Of course it is possible to keep network records in text documents, but it is very difficult to use them later. A more sound way to keep such documentation is to create a network diagram that might represent either logical network structure or physical. These diagrams are easy to understand and you will thank yourself later.
There is a physical network diagram. It is a tool to represent, maintain and analysis of network equipment and interconnections. Network diagram depicts the actual network information in the attractive clear graphic form. One can learn here the LAN cable length, telecommunication type and carrying capacity. The diagram depicts servers, IP address and domain name as well. Also it shows location of hubs, switches, modems, routers, and other network equipment. The sets of special symbols and images delivered with ConceptDraw Network Diagrams solution are used to show network components. Symbols have a standard view. Therefore, various specialists can read the network diagram without any discrepancies.
Picture: Network diagrams with ConceptDraw DIAGRAM
Related Solution:
Easy charting software comes with beautiful chart templates and examples. This makes it easy to create professional charts without prior experience.
Picture: Chart Examples
Related Solutions:
My friend works as a marketologist. Once he asked me about Marketing and Sales Organization chart, as it was new for him. Luckily, ConceptDraw Solution Park has tons of examples to show to an unexperienced user.
This organizational chart was designed with ConceptDraw DIAGRAM and its Organizational Charts solution, that can be find in the Management section of Solution Park. This solution offers a vector objects library and a set of samples and templates. The vector library contains symbols and icons that provide you with possibility to show the organizational structure of your organization at a glance. It allows to depict the interrelations of authority and responsibility between positions in an organization. Organizational charts provide both employers and employees a clear view of the sale and marketing departments structure, reporting system, management levels.
Picture: Marketing and Sales Organization chart.Organization chart Example
Related Solution:
The question how to create a column chart have a simple answer. Use ConceptDraw tips to find out how to create a column chart depicts your data the best way.
Picture: How to Create a Column Chart
Related Solution: