Cross-Functional Flowchart (Swim Lanes)
 *")
Diagramming Software for Design Business Process Diagrams


Swim Lanes

Swim Lane Flowchart Symbols

Cross-Functional Process Map Template

Business Process Elements: Swimlanes

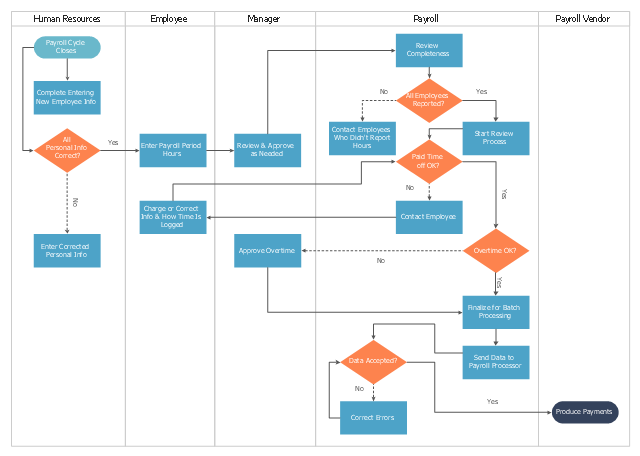
This cross-functional flowchart sample represents the payroll process mapping.
"Business process mapping refers to activities involved in defining what a business entity does, who is responsible, to what standard a business process should be completed, and how the success of a business process can be determined.
The main purpose behind business process mapping is to assist organizations in becoming more efficient. A clear and detailed business process map or diagram allows outside firms to come in and look at whether or not improvements can be made to the current process.
Business process mapping takes a specific objective and helps to measure and compare that objective alongside the entire organization's objectives to make sure that all processes are aligned with the company's values and capabilities.
ISO 9001 requires a business entity to follow a process approach when managing its business, and to this end creating business process maps will assist. The entity can then work towards ensuring its processes are effective (the right process is followed the first time), and efficient (continually improved to ensure processes use the smallest amount of resources)." [Business process mapping. Wikipedia]
The business process map example "Swim lane diagram - Payroll process mapping" was drawn using the ConceptDraw PRO diagramming and vector drawing software extended with the Cross-Functional Flowcharts solution from the Business Processes area of ConceptDraw Solution Park.
Cross-functional flowchart
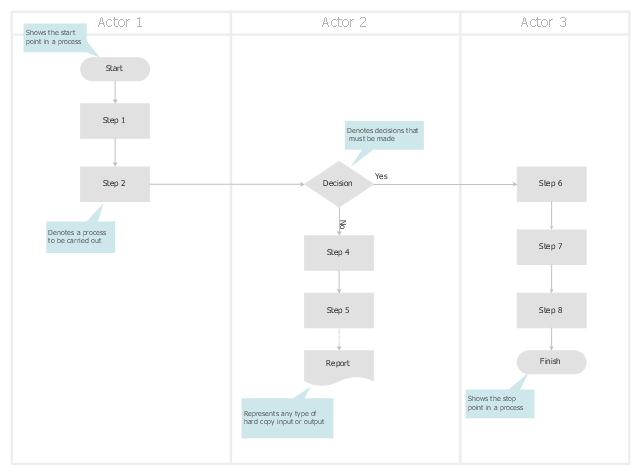
Swim lane business process maps are the type of flow charts that show the organization structure. The maps arranged on a table where the columns or rows display the actors responsible for the steps. The actors may be persons, departments or organizations. Swim lane maps are used to defining of the process bottlenecks and overloaded resources.
The swim lane business process map template for the ConceptDraw PRO diagramming and vector drawing software is included in the Cross-Functional Flowcharts solution from the Business Processes area of ConceptDraw Solution Park.
The swim lane business process map template for the ConceptDraw PRO diagramming and vector drawing software is included in the Cross-Functional Flowcharts solution from the Business Processes area of ConceptDraw Solution Park.
Swim lane process map template
Swim Lanes Flowchart. Flowchart Examples


 Business Process Mapping
The Business Process Mapping solution for ConceptDraw DIAGRAM is for users involved in process mapping and creating SIPOC diagrams.
 Cross-Functional Flowcharts
Cross-functional flowcharts are powerful and useful tool for visualizing and analyzing complex business processes which requires involvement of multiple people, teams or even departments. They let clearly represent a sequence of the process steps, the order of operations, relationships between processes and responsible functional units (such as departments or positions).
Business Process Flowchart Symbols

How to Dramatically Reduce Drawing Time - New connection modes

Swim Lane Diagrams

 Flowcharts
The Flowcharts solution for ConceptDraw DIAGRAM is a comprehensive set of examples and samples in several varied color themes for professionals that need to represent graphically a process. Solution value is added by the basic flow chart template and shapes' libraries of flowchart notation. ConceptDraw DIAGRAM flow chart creator lets one depict the processes of any complexity and length, as well as design the Flowchart either vertically or horizontally.
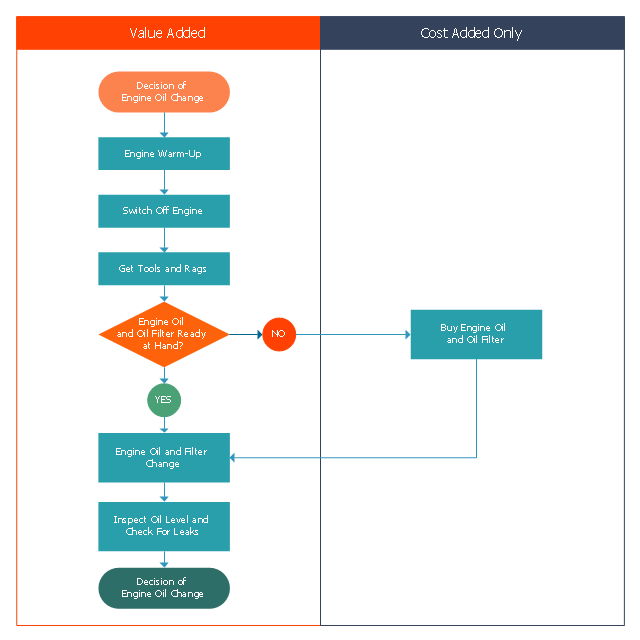
This opportunity flowchart sample shows the steps involved in replacing engine oil process. The opportunity flowcharts are used in business process improvement to identify process steps which might be improved.
"Business process improvement (BPI) is a systematic approach to help an organization optimize its underlying processes to achieve more efficient results. ...
An organization is only as good as its processes. To be able to make the necessary changes in an organization, one needs to understand the key processes of the company. Rummler and Brache suggested a model for running a Process Improvement and Management project (PI&M), containing the following steps:
1. Identify the process to be improved (based on a critical business issue): The identification of key processes can be a formal or informal exercise. The management team might select processes by applying a set of criteria derived from strategic and tactical priorities, or process selection is based on obvious performance gaps. It is important is to select the process(es) which have the greatest impact on a competitive advantage or customer requirement.
2. Develop the objective(s) for the project based on the requirements of the process: The focus might be on quality improvement, productivity, cost, customer service or cycle time. The goal is however always the same; to get the key process under control.
3. Select the members of the cross-functional team: A horizontal (cross-functional) analysis is carried out by a team composed of representatives of all functions involved in the process. While a consultant or in-house staff person can do the job, the quality of the analysis and the commitment to change is far greater with a cross-functional team.
4. Document the current process by creating a flowchart or "organization map": Describe the process regarding the Organizational level, the Process level and the Job/ Performer level according to Rummler. Develop a cross-functional process map for the process.
5. Identify "disconnects" in the process: “Disconnections” are everything that inhibit the efficiency and effectiveness of the process. The identification should be categorized into the three levels: The Organizational level, the Process level and the Job/ Performer level.
6. Recommend changes (organizational, in the process or in its execution): Categorize and prioritize the main problems and possibilities, evaluate alternative solutions. Develop a cross-functional process map for the recommended process.
7. Establish process and sub-process measures: The process measures should reflect the objectives of the project.
8. Implement the improvements." [Business process improvement. Wikipedia]
The swim lane diagram example "Opportunity flowchart - Replacing engine oil" was created using the ConceptDraw PRO diagramming and vector drawing software extended with the Cross-Functional Flowcharts solution from the Business Processes area of ConceptDraw Solution Park.
Swim lane diagram
Process Mapping

Business Mapping Software

Best Flowchart Software and Flowchart Symbols

The Best Business Process Modeling Software

- Swim Lane Flowchart Symbols | Swim Lane Diagrams | Swim Lanes ...
- Swim Lane Diagrams | Types of Flowcharts | Business Process ...
- Business Process Mapping — How to Map a Work Process | How to ...
- Swim Lane Diagrams | Swim Lanes Flowchart. Flowchart Examples ...
- UML activity diagram ( swimlanes ) - Template | Payroll process ...
- Samples of Flowchart | IDEF0 Diagram | Cross-Functional Flowchart ...
- Cross-Functional Flowchart ( Swim Lanes ) | Swim Lane Flowchart ...
- Swim Lane Diagrams | Swim Lane Flowchart Symbols | Swim Lanes ...
- Work Order Process Flowchart. Business Process Mapping ...
- Cross-Functional Process Map Template | Chemical Engineering ...
- Cross-Functional Flowchart ( Swim Lanes ) | Business Process ...
- Payroll process - Swim lane process mapping diagram | Process ...
- Simultaneous Activity Flow Chart
- Cross-Functional Process Map Template | Swim lane process map ...
- Swim Lane Diagrams | Swim Lane Flowchart Symbols | Cross ...
- Cross-Functional Flowchart ( Swim Lanes ) | Swim Lane Diagrams ...
- Cross-Functional Flowchart ( Swim Lanes ) | Swim lane diagram ...
- Swim Lane Flowchart Symbols | Swim Lane Diagrams | Business ...
- Swim lane diagram - Payroll process mapping | Cross-Functional ...