A KPI Dashboard Provides the Answers Your Sales Team
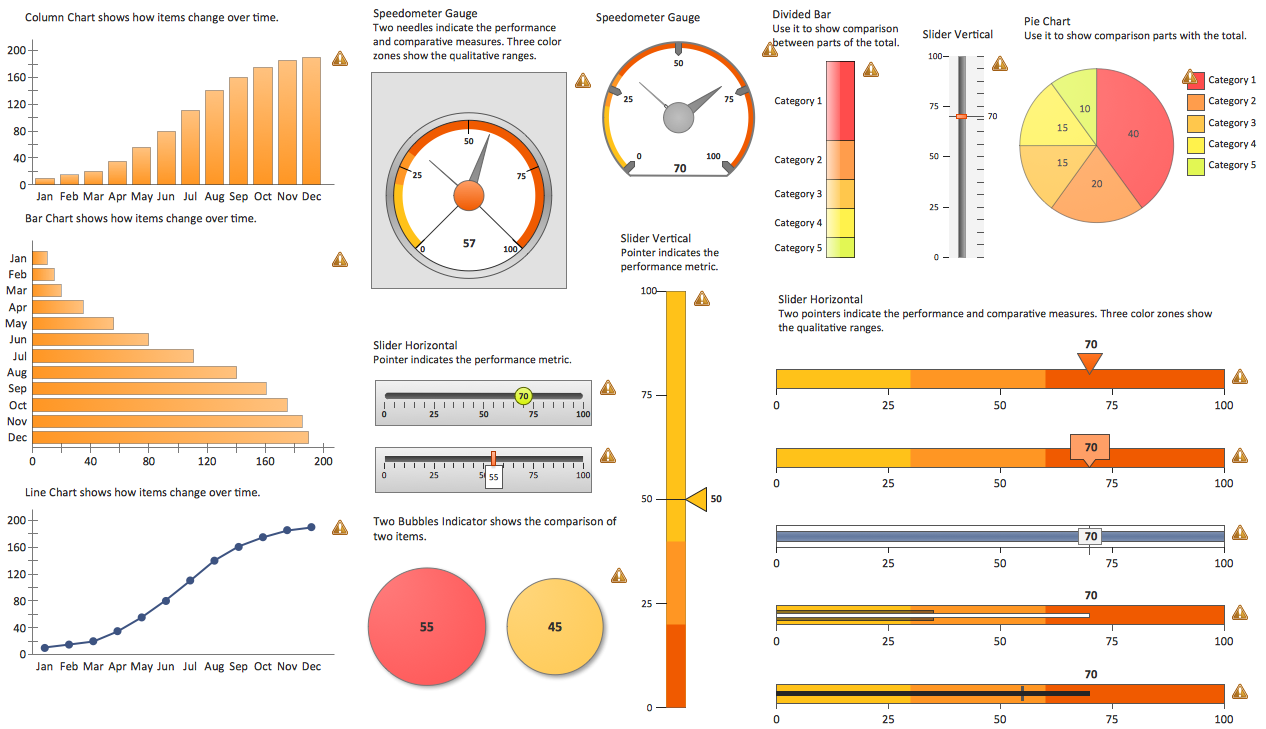
Sales dashboard is a tool that provides the answers to all questions your sales team may have. A mature sales dashboard provides complete set of KPI to shows corporate, team or personal performance to keep sales process clear.How To Plan and Implement Projects Faster
ConceptDraw Office is the most effective tool for planning, tracking, and reporting all types of projects with strong management capabilities, user friendly functionality, and superior ease of use. In this tutorial video we will assist you in planning and managing a project using ConceptDraw Office.Business Diagram Software
When managing the projects, people, or networks, there are daily designed and used different types of Business diagrams, so the powerful drawing software will be very useful for this. ConceptDraw DIAGRAM with large quantity of business solutions will meet your needs and will help you convey your ideas successful and rapidly, no matter are you professional or beginner. It is the best choice for business specialists and technical professionals who need quickly and easily explore, visualize, and communicate information. ConceptDraw DIAGRAM business diagram software is the most powerful business software and relational charting software. Create advanced, completely customizable Business Process Diagrams, Business Flow Charts, Work Flow Diagrams, Organizational Charts, Audit diagrams, Marketing diagrams, Value Stream Maps, TQM diagrams, ERD diagrams, EPC diagrams, Cause and Effect diagrams, Infographics, Dashboards, and other Relational business diagrams from your data using the powerful drawing tools of ConceptDraw Solution Park.
Critical Path Method in ConceptDraw PROJECT
The Critical Path Method (CPM) is an algorithm for scheduling a set of project activities. It is an important tool for effective project management. ConceptDraw PROJECT implements this method to provide the user with a wide set of project management tools.Project — Working With Costs
ConceptDraw PROJECT delivers a rich set of built-in functionalities and optional product extensions that support your daily workflow in time-saving and creative ways. This video lesson will teach you how to work with costs in your project document.Applications
ConceptDraw DIAGRAM is a multipurpose software from ConceptDraw suite intended for diagramming, business and technical drawing, and visual documenting. You can reach a lot of practical benefits from the use of ConceptDraw DIAGRAM. The list of ConceptDraw DIAGRAM applications and versatile possibilities is extremely great. Among them network and system diagramming, business diagramming, Cisco network design, network visualization, software and database design, software development, business flowcharting, data flow design, databases modeling and visualization, business processes modeling, business drawing, technical drawing, GUI prototyping, Organizational charts construction, business processes fixing, web site planning and design, Internet solutions design, information architecture design, UML modeling, ER diagrams design, home and landscape design, and a lot of other applications. ConceptDraw DIAGRAM offers the users a beneficial collaboration, compatibility with MS Visio and many other popular programs, including other products from ConceptDraw suite.Visualize Sales Data Using Sample Data
ConceptDraw DIAGRAM software extended with the Sales Dashboard solution allows you visualize sales data using sample data delivered with the solution to choose visual indicators you need, and then connect these indicators to your real data.Data Visualization Software Solutions
To see how your business can improve you can try data visualization software solutions that allows you visualize all your sales KPI in one sales dashboard allows you monitor and analyse sales activities.
 Business Productivity Area
Business Productivity Solutions extend ConceptDraw products with tools for making presentations, conducting meetings, preparing documents, brainstorming, or building new strategies.
Sales Teams are Inherently Competitive
Sales teams are inherently competitive, so you don't need to invent extra ways to stimulate the competition. At the same time, you can provide the team with a sales dashboard shows company, team and personal KPI to make the competition clear.TQM Diagram — Professional Total Quality Management
The Total Quality Management Diagram solution helps you and your organization visualize business and industrial processes. Create Total Quality Management diagrams for business process with ConceptDraw software.ConceptDraw DIAGRAM : Able to Leap Tall Buildings in a Single Bound
ConceptDraw DIAGRAM is the world’s premier cross-platform business-diagramming tool. Many, who are looking for an alternative to Visio, are pleasantly surprised with how well they can integrate ConceptDraw DIAGRAM into their existing processes. With tens of thousands of template objects, and an easy method for importing vital custom objects from existing Visio documents, ConceptDraw DIAGRAM is a powerful tool for making extremely detailed diagrams, quickly and easily.Relationships Analysis
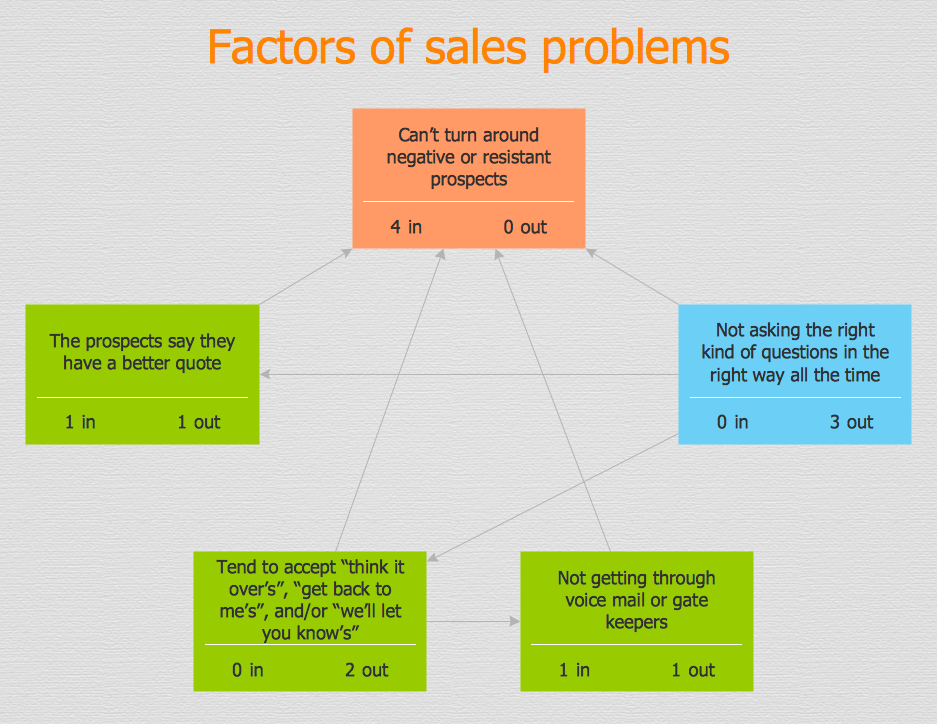
Relationships Analysis. Relations Diagram - factors analysis, factors relations. Create Relations Diagram with ConceptDraw DIAGRAM. The Seven Management and Planning Tools is a tool for Interaction diagram drawing. This diagram identifies causal relationships. Determine what factors are causes and which factors are effects. Interaction diagram helps establish KPIs to monitor changes and the effectiveness of corrective actions in resolving the problem.
PROBLEM ANALYSIS. Relations Diagram
Use the Relations Diagram to create a relations factors map and to identify which factors are “drivers” and “indicators”. This diagram identifies causal relationships and determine what factors are causes or effects. ConceptDraw Office suite is a software for relation diagram making.
- Business diagrams & Org Charts with ConceptDraw PRO | A KPI ...
- A KPI Dashboard Provides the Answers Your Sales Team | Visualize ...
- Pyramid Chart Examples | Pyramid Diagram | Sales Dashboard |
- KPIs and Metrics | Correlation Dashboard | TQM Diagram Tool |
- Sales KPI Dashboards | A KPI Dashboard | KPIs and Metrics |
- A KPI Dashboard | Sales KPI Dashboards | A KPI Dashboard ...
- Business diagrams & Org Charts with ConceptDraw PRO ...
- | KPIs and Metrics | What is a Dashboard Area |
- A KPI Dashboard | KPIs and Metrics | Sales KPI Dashboards |
- A KPI Dashboard Provides the Answers Your Sales Team
- Sales Dashboard Template | Europe spatial dashboard template ...
- A KPI Dashboard | A KPI Dashboard Provides the Answers Your ...
- Meter Dashboard | Status Dashboard | Spatial Dashboard |
- Spatial Dashboard | Meter Dashboard | Status Dashboard |
- Sales Dashboard Template | Meter Dashboard | Composition ...
- Comparison Dashboard | What is a Dashboard Area | Spatial ...
- PM Dashboards | A KPI Dashboard | Sales KPI Dashboards |
- KPIs and Metrics | A KPI Dashboard | Sales KPI Dashboards |
- Development of software with ConceptDraw PRO | PM Dashboards ...
- Sales KPI Dashboards


