 Business Intelligence Dashboard
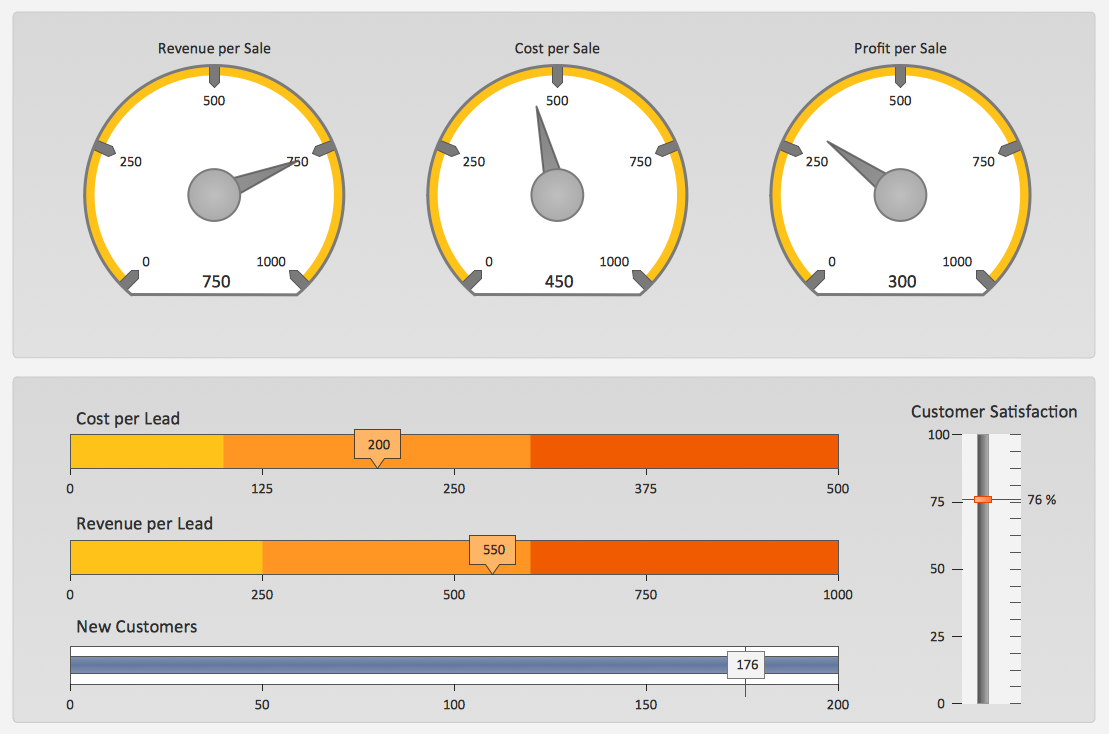
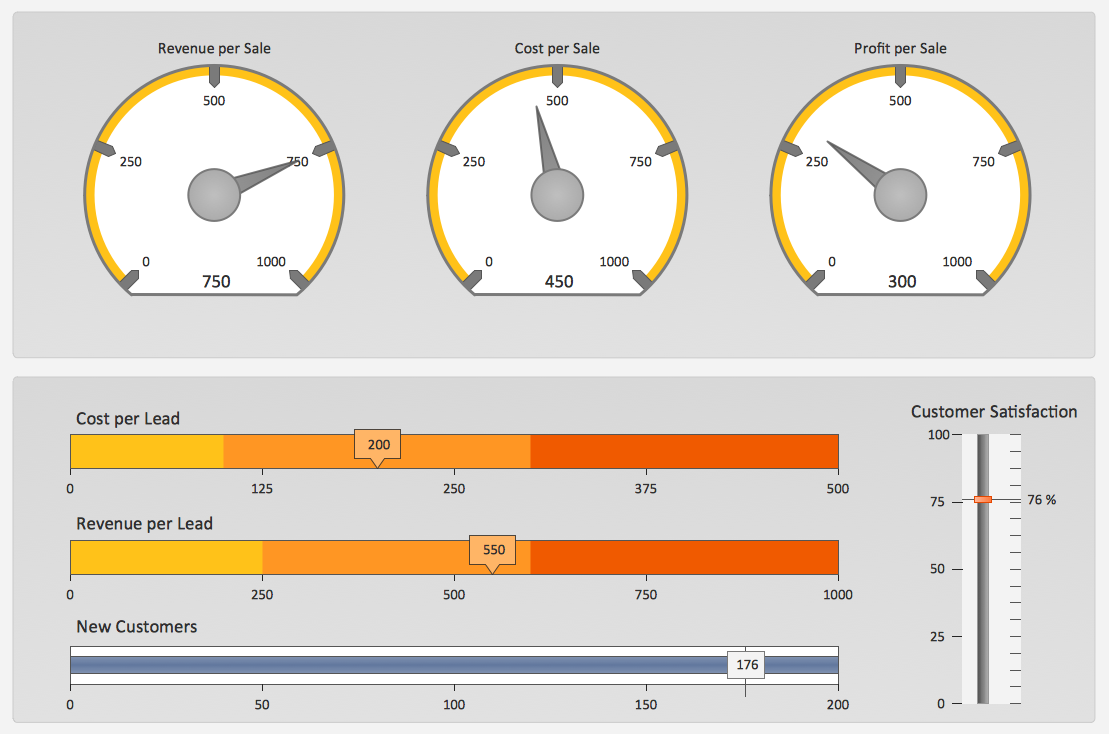
Business Intelligence Dashboard solution extends the ConceptDraw PRO v11 functionality with exclusive tools, numerous ready-to-use vector objects, samples and quick-start templates for creation professional Business Intelligence Dashboards, Business Intelligence Graphics, Business Intelligence Charts and Maps of different kinds. Design easy the BI dashboard, BI model or Dynamic chart in ConceptDraw PRO to monitor the company's work, to track the indicators corresponding your company's data, to display and analyze key performance indicators, to evaluate the trends and regularities of the processes occurring at the company.
Sales Dashboards for Your Company
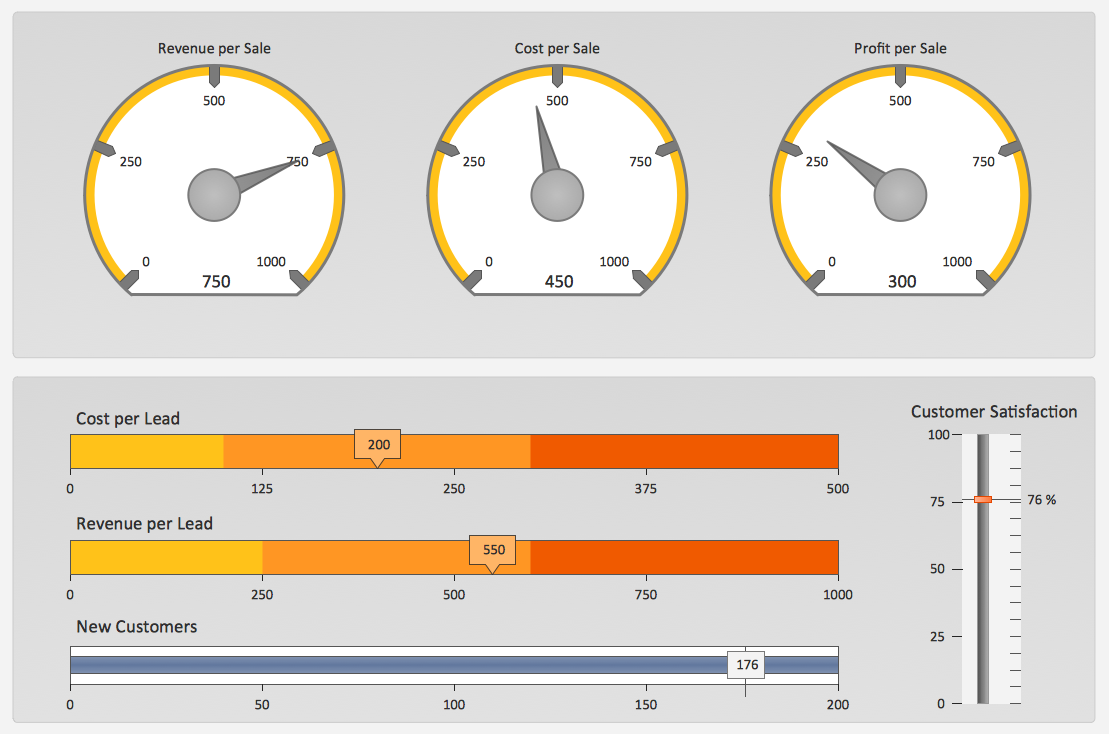
ConceptDraw PRO software extended with the Sales Dashboard solution allows you produce sales dashboards for your company easily. You can start from samples and templates delivered with the solution and then modify them to get a dashboard that suites your specific needs.HelpDesk
How to Make Business Intelligence Dashboard
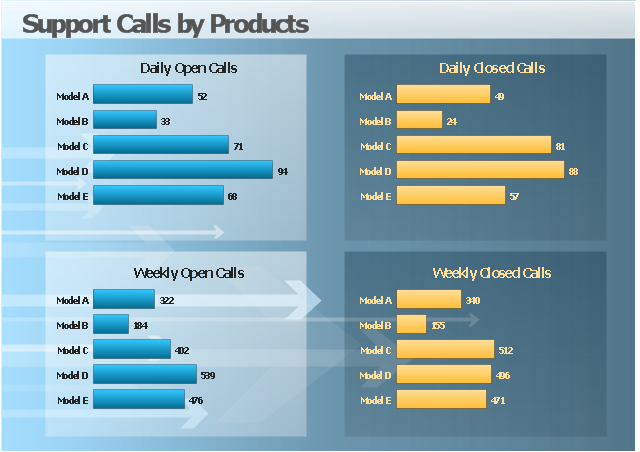
The business data represented in the view of dashboard can show the real picture of the activity of the entire organization, or it can display particular information like website effectiveness, call center statistics, and more business KPIs in the company. Dashboards provides managers, marketers, and analysts to quickly sort out the position of the company and to determine the weakest links. The dashboard helps to to compare easily different stages of business process and to accomplish the right decision. Business Intelligence Solution for ConceptDraw PRO makes for a powerful analytical tool that displays an organization’s processes and provides valuable competitive insight into business performance.The business dashboard example "Support calls by products" contains 4 horizontal bar charts used for the comparison of support calls data by products.
"A bar chart or bar graph is a chart with rectangular bars with lengths proportional to the values that they represent. The bars can be plotted vertically or horizontally. A vertical bar chart is sometimes called a column bar chart. ...
A bar graph is a chart that uses either horizontal or vertical bars to show comparisons among categories. One axis of the chart shows the specific categories being compared, and the other axis represents a discrete value." [Bar chart. Wikipedia]
The visual dashboard example "Support calls by products" was created using the ConceptDraw PRO diagramming and vector drawing software extended with the Comparison Dashboard solution from the area "What is a Dashboard" of ConceptDraw Solution Park.
Dashboard
ConceptDraw PRO extended with Sales Dashboard solution from the Marketing area of ConceptDraw Solution Park is a perfect software for creating the live dashboard for the business data and progress visualization.Sales Dashboard - Access Anywhere
ConceptDraw Sales Dashboard is an automatically updated sales dashboard you can customize to see KPI you need. You can access sales dashboard anywhere to get fresh data and use any minute to see how your business can improve.Reporting Dashboard Software for Business
An effective way to improve your business is using reporting dashboard software. ConceptDraw PRO software extended with the Sales Dashboard solution helps you monitor all KPI on the one screen in real time.Business Intelligence Dashboard Software
ConceptDraw PRO is a business intelligence dashboard software that allows you produce sales dashboard that suites your specific needs. To see how your business can improve with sales dashboards select KPI and start tracking it.A KPI Dashboard
Composing a dashboard from different KPI is a kind of art. Visualizing sales data you have to keep balance to keep your dashboard informative, not messy. ConceptDraw Sales Dashboard solution gives you a set of good examples of balanced dashboards.Sales Dashboard Template
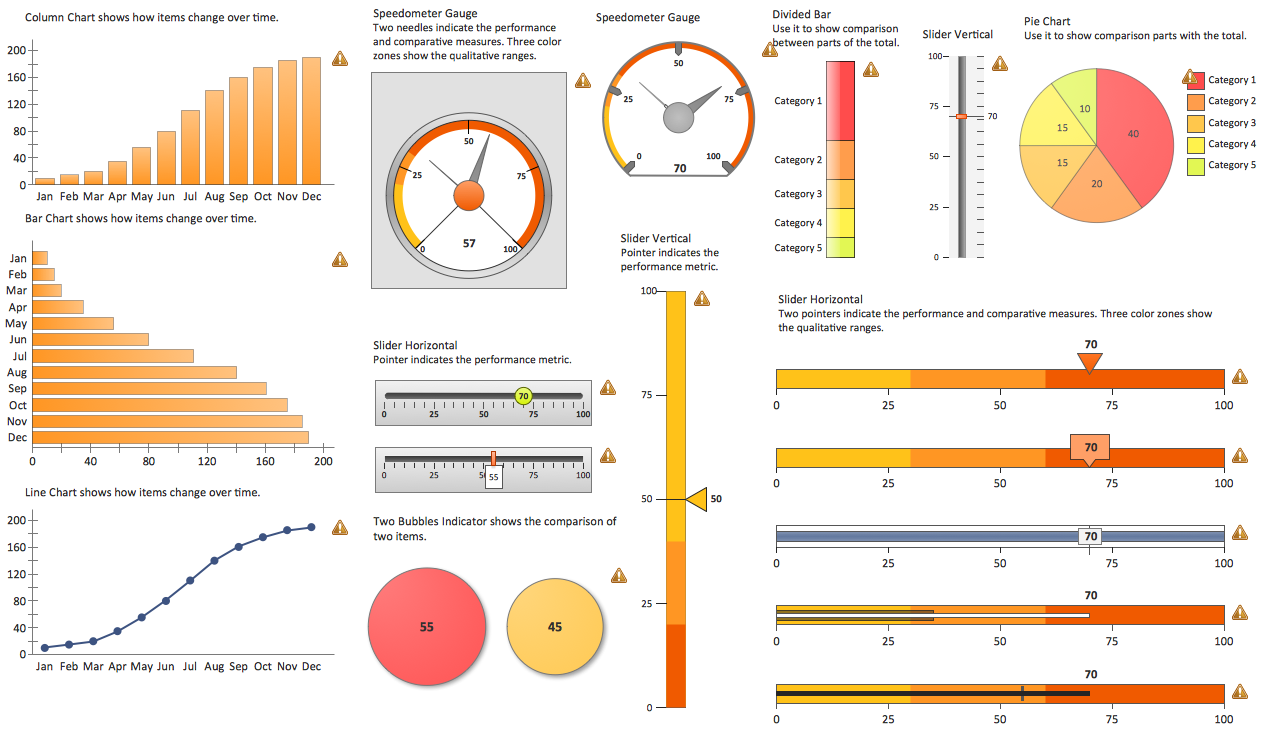
ConceptDraw PRO software extended with the Sales Dashboard solution delivers a complete set of samples, templates and pre-designed objects you need for visualizing sales data.Data Visualization Software Solutions
To see how your business can improve you can try data visualization software solutions that allows you visualize all your sales KPI in one sales dashboard allows you monitor and analyse sales activities.Sales Dashboard Solutions can help your sales team keep an eye on performance
ConceptDraw Sales Dashboard Solution is a simple and effective way of visualizing sales data and get clear picture of your sales process to see how your business can improve.Reporting & Data Visualization
Using professional reporting and data visualization is the way your business can improve. ConceptDraw Sales Dashboard solution allows you produce live dashboards show KPI to monitor you sales activity and results in real time.The Facts and KPIs
Visualizing sales data help you see the facts and KPIs about your sales process to make conclusions and see how your business can improve.- Sales Dashboards for Your Company | Business Intelligence ...
- Sales Dashboard Template | Business Intelligence Dashboard ...
- Business Intelligence Dashboard Software | How to Create ...
- Business Dashboards Examples
- Business Graphics Software | KPI Dashboard | Business Intelligence ...
- New Business Intelligence Dashboard Solution for ConceptDraw PRO
- Business Intelligence Dashboard Software | Sales Dashboard ...
- Dashboard Software | Business Intelligence Dashboard Software ...
- Business Intelligence Dashboard | 25 Typical Orgcharts | How to ...
- Business Intelligence Dashboard Software | Reporting Dashboard ...
- How To Create Project Report | Dashboard | Business Intelligence ...
- Design elements - Sales dashboard | Sales Dashboard - Access ...
- KPI Dashboard | What is a KPI? | Sales Dashboards for Your ...
- Sales Dashboard - Access Anywhere | Business Intelligence ...
- Sample Business Dashboard
- Support calls by products - Business dashboard | Composition ...
- Enterprise dashboard | Manufacturing and Maintenance | Business ...
- KPI Dashboard | Enterprise dashboard | Business Graphics ...
- Business Intelligence Dashboard Software | Sale dashboard | Sales ...

