Sales Dashboard Solutions
can help your sales team keep an eye on performance
Sales Dashboard Solution
ConceptDraw DIAGRAM is a software for making dashboards that provide effectiveness to your sales team. The Sales Dashboard Solution allows managers to use live data to drive dashboards that show sales performance in a wide variety of graphs. Dashboards allow you to capture and report specific data points from sales department of the organization, thus providing a "snapshot" of performance.

Pic. 1. Sales KPIs Dashboard Sample
FOUR RELATED HOW TO's:
ConceptDraw DIAGRAM software exteneded with the Sales Dashboard solution is perfect for visualizing sales data. This is the best tool to analyse your sales perfornance and see how your business can improve.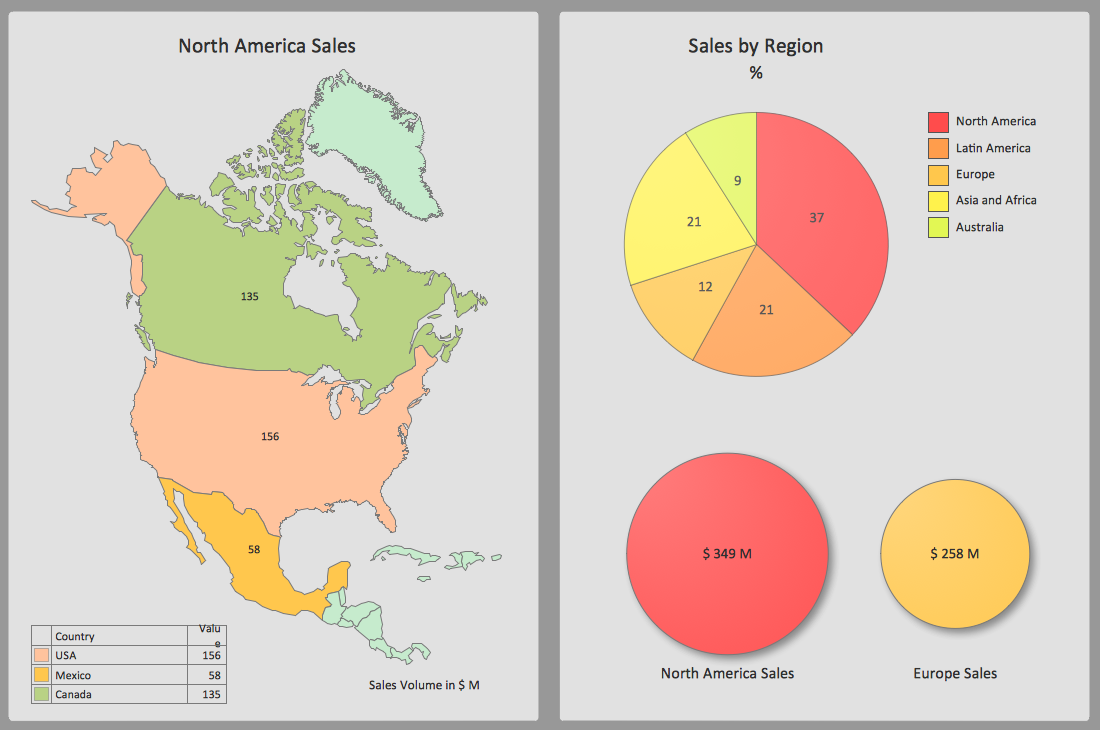
Picture: Sales Dashboard Screenshot
ConceptDraw Sales Dashboard solution allows you empower your sales team with a sales dashboard that visualizes all team and personal KPI your team need to work effectively.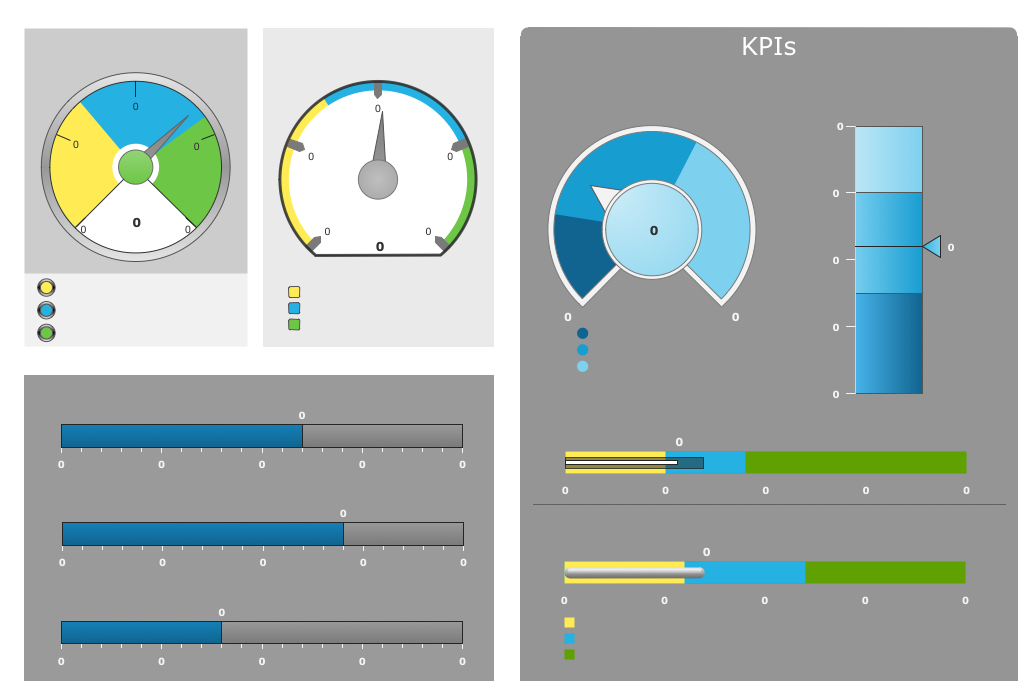
Picture: Empower Your Sales Team With a Sales Dashboard
Composing a dashboard from different KPI is a kind of art. Visualizing sales data you have to keep balance to keep your dashboard informative, not messy. ConceptDraw Sales Dashboard solution gives you a set of good examples of balanced dashboards.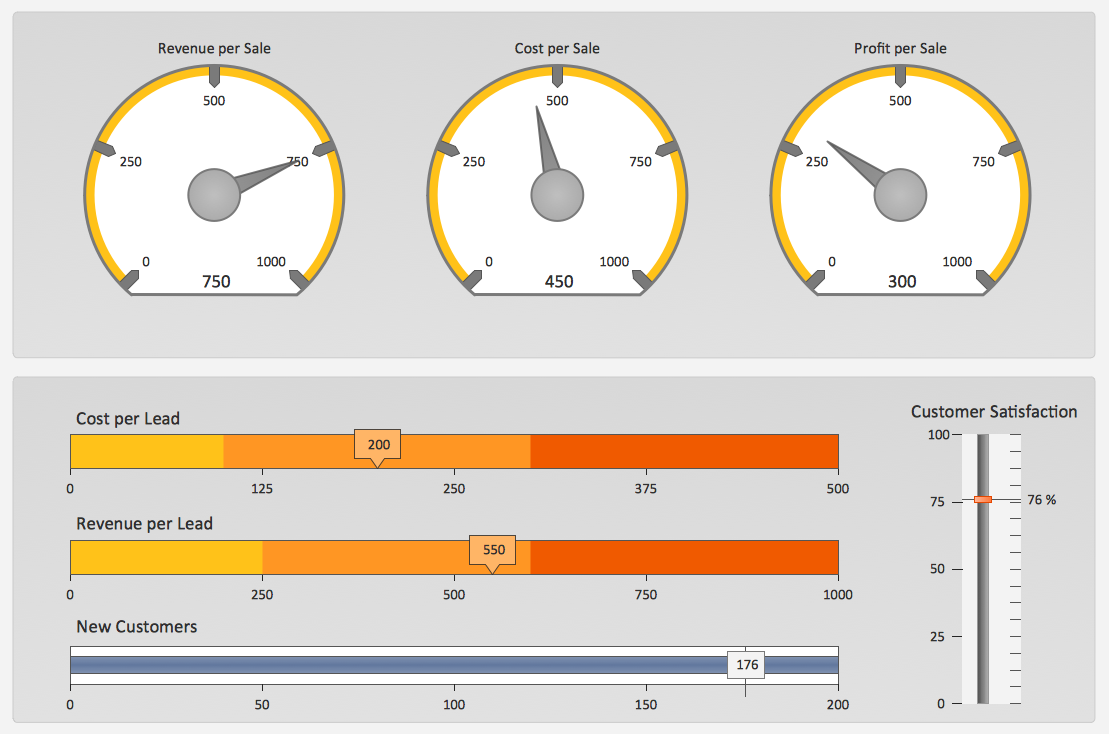
Picture: A KPI Dashboard
What is a KPI? Key performance indicators (KPIs) represent a set of measures that are focused on the aspects of organizational performance which are the most important for its current and future success.
ConceptDraw DIAGRAM diagramming and vector drawing software enhanced with Sales Dashboard solution from the Marketing area of ConceptDraw Solution Park allows effectively develop, analyze and improve your business thanks to the excellent possibility of monitoring all KPIs on one screen in a real time.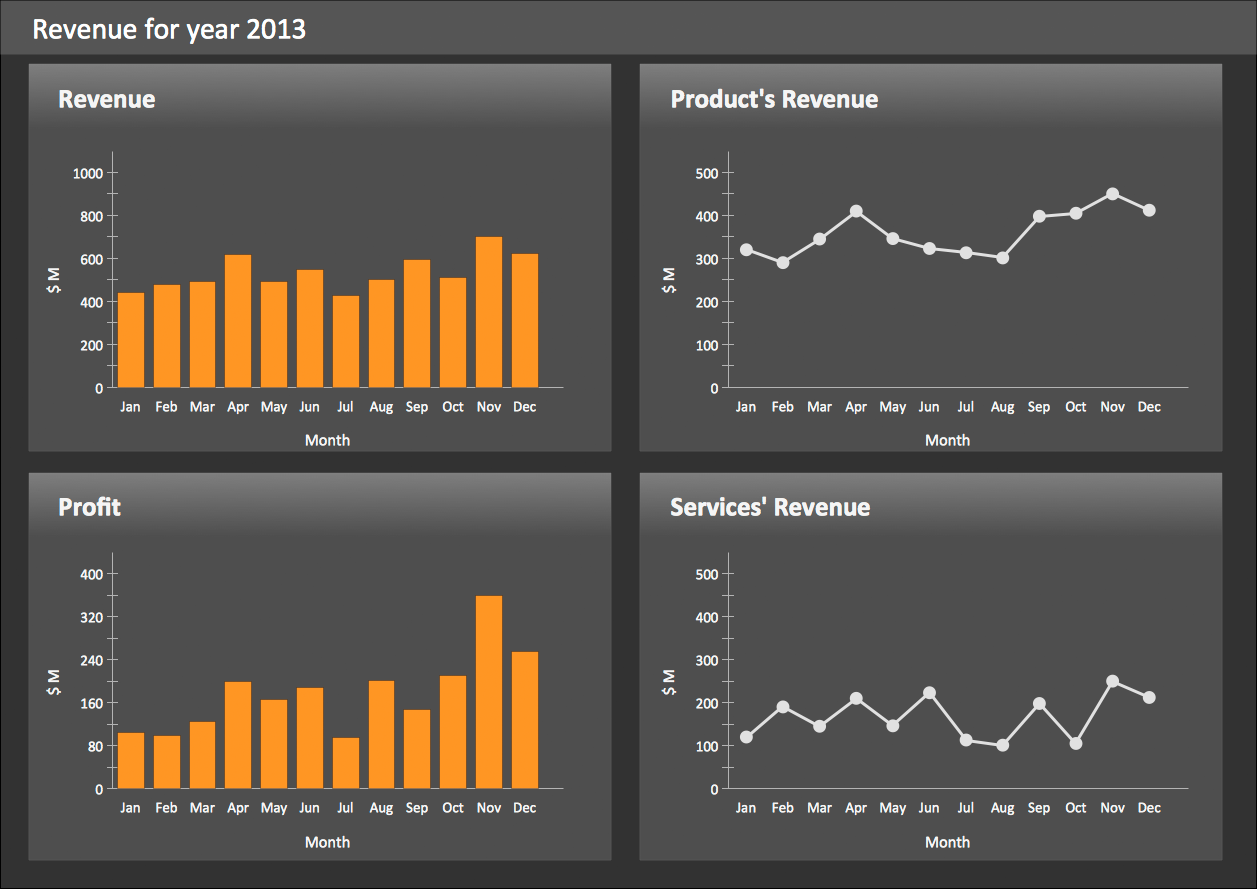
Picture: What is a KPI?
Related Solution:
ConceptDraw
DIAGRAM 18