Reporting & Data Visualization
Sales Dashboard Solution
The Sales Dashboard Solution gives users the ability to use live data to drive displays that show sales performance in a wide variety of graphs. Dashboards allow you to capture and report specific data points from each department within the organization, thus providing a "snapshot" of performance. By using dashbords one obtain benefits:
- Measure efficiencies/inefficiencies
- Ability to generate detailed reports
- Saves time compared to running multiple reports
- Gain total visibility of all systems instantly
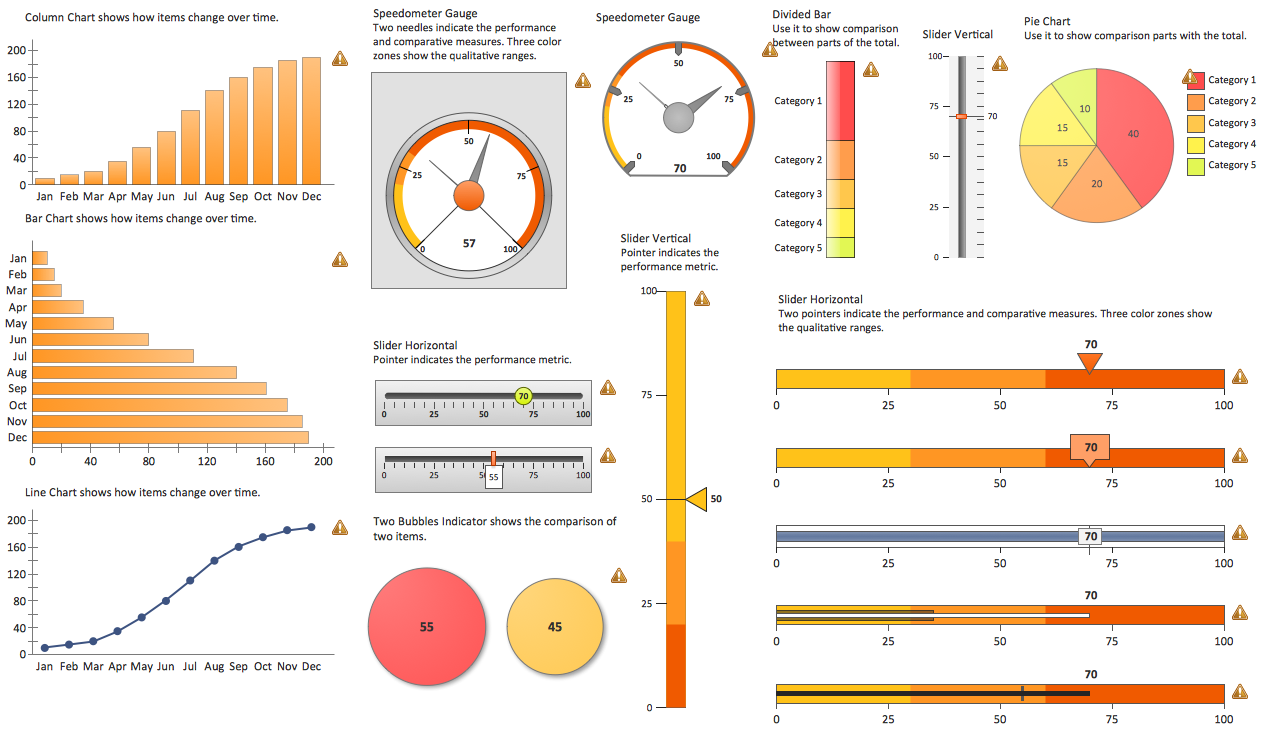
Pic. 1. Sales Dashboard Design Elements
One library with 25 indicators is included in the Sales Dashboard.
FOUR RELATED HOW TO's:
There are lots of ways you can visualize sales data, and the simplest way is using ConceptDraw Sales Dashboard solution for ConceptDraw DIAGRAM. You just need to connect your data to one of pre-designed dashboards, and then you can see dynamic picture of changes.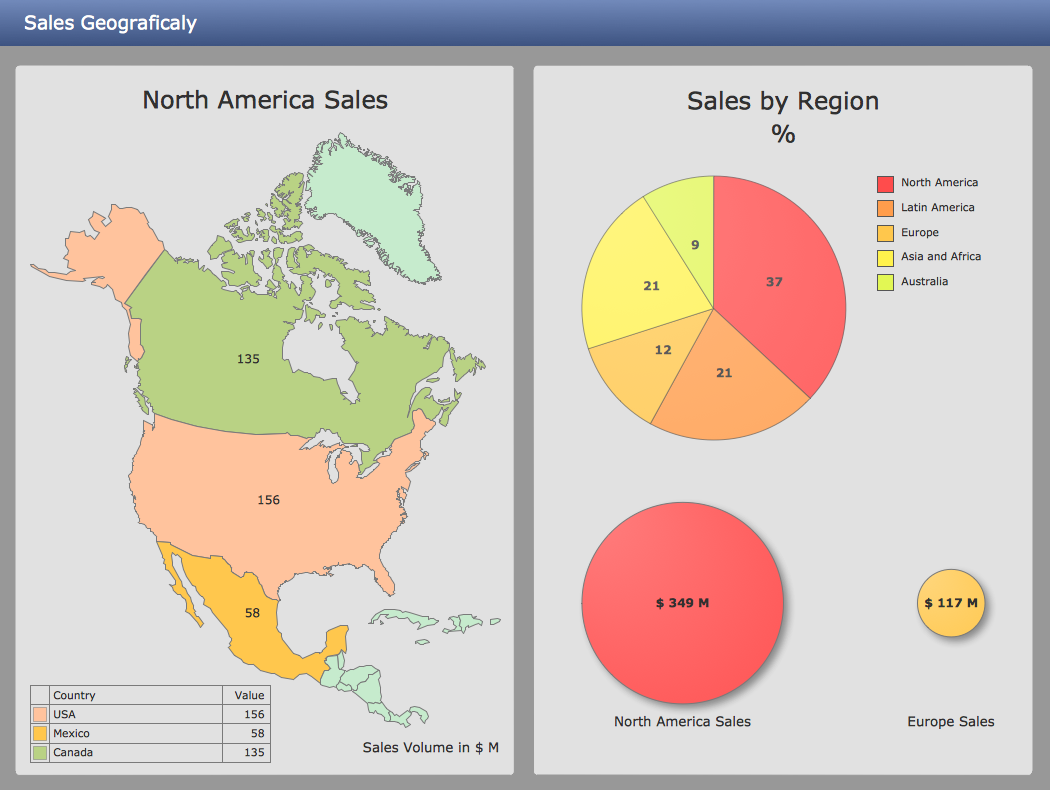
Picture: Ways You Can Visualize Sales Data
Working with information can be quite tedious, furthermore, some data can be quite difficult to perceive without any graphic representation. So, to facilitate your work, you can use business diagrams, such as simple flowcharts or Gantt charts for project management and orgcharts for clarifying your company structure. You can use a proper software, like ConceptDraw Pro, draw them on paper, or use whiteboards, but it is more convenient to use a digital tool.
This diagram shows a cross-functional flowchart that was made fore telecom service provider. A workflow of a common telecommunication service provider has a rather branched structure. Thus, it is useful to have a flow chart to visualize the sequences and interrelations of the work flow steps. Business process flowchart contains 17 processes and 4 decision points,that are distributed through 2 lines depicting the participants involved. Also there are connectors that show the data flow within processes. This flowchart displays a detailed model of the telecom service trading process, as well as all participants in the process and how they interact with each other.
Picture: Business diagrams & Org Charts with ConceptDraw DIAGRAM
ConceptDraw DIAGRAM software exteneded with the Sales Dashboard solution is perfect for visualizing sales data. This is the best tool to analyse your sales perfornance and see how your business can improve.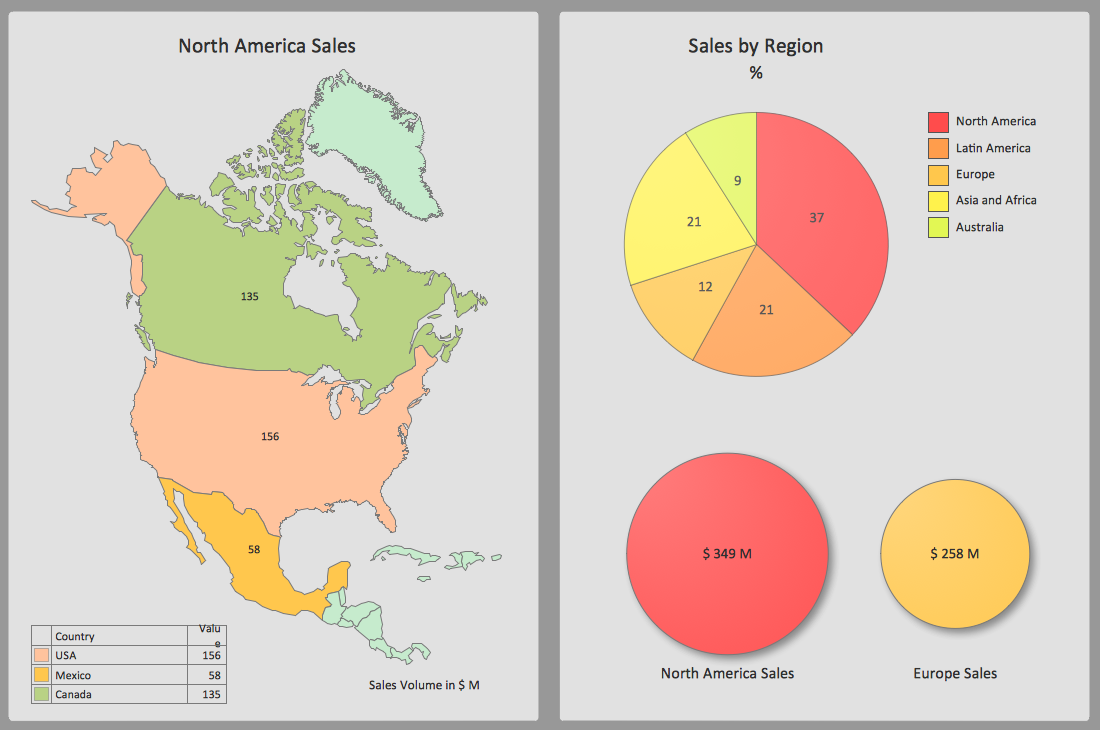
Picture: Sales Dashboard Screenshot
Data visualization solutions help you to see how your business can improve. Visualizing sales data using ConceptDraw Sales Dashboard gives you a bird's-eye view of the sale process.
Picture: Data Visualization Solutions
ConceptDraw
DIAGRAM 18