Reporting Dashboard Software for Business
Sales Dashboard Solution
The Sales Dashboard Solution gives users the ability to use live data to drive displays that show sales performance in a wide variety of graphs. ConceptDraw DIAGRAM is a software for making Live charts anв gauges that provide effectiveness to your business. Dashboards allow you to capture and report specific data points from each department within the organization, thus providing a "snapshot" of performance. By using dashboards one obtain benefits:
- Measure efficiencies/inefficiencies
- Ability to generate detailed reports
- Saves time compared to running multiple reports
- Gain total visibility of all systems instantly
Pic. 1. Sales Dashboard Design Elements (Apple macOS)
THREE RELATED HOW TO's:
Sales teams are inherently competitive, so you don't need to invent extra ways to stimulate the competition. At the same time, you can provide the team with a sales dashboard shows company, team and personal KPI to make the competition clear.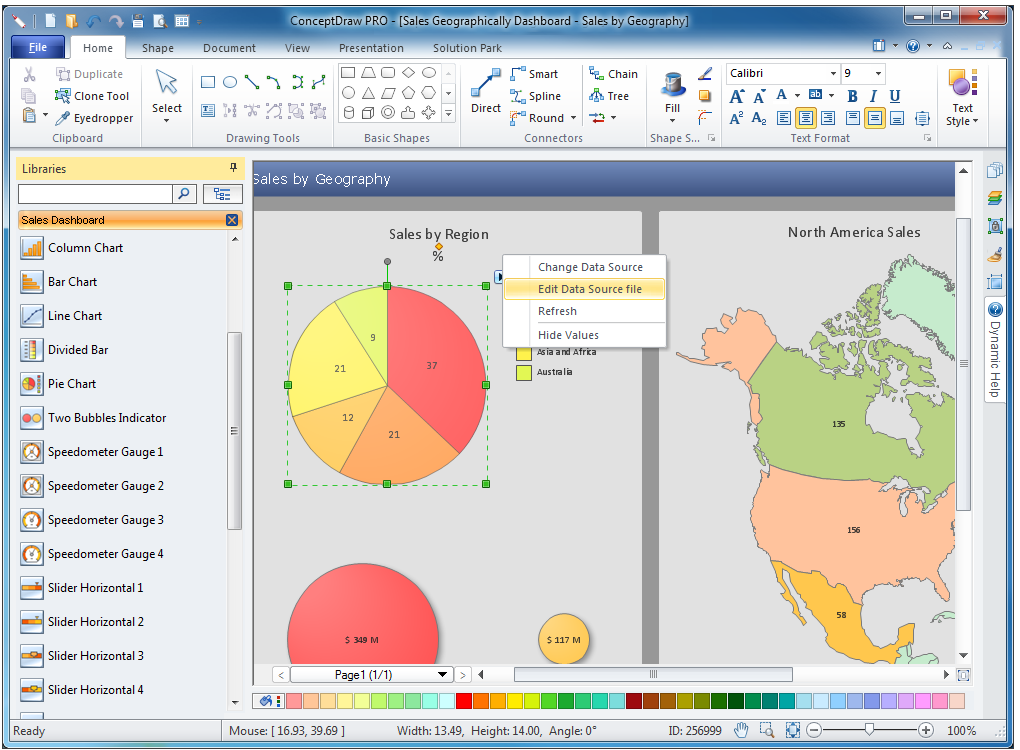
Picture: Sales Teams are Inherently Competitive
Charting Software allows you to create diagrams, charts, graphs, flowcharts, and other business graphics. ConceptDraw DIAGRAM include simple shape drawing tools, examples, templates, and symbol libraries.
Picture: Create Graphs and Charts
Related Solution:
ConceptDraw DIAGRAM software extended with the Sales Dashboard solution allows you produce sales dashboards for your company easily. You can start from samples and templates delivered with the solution and then modify them to get a dashboard that suites your specific needs.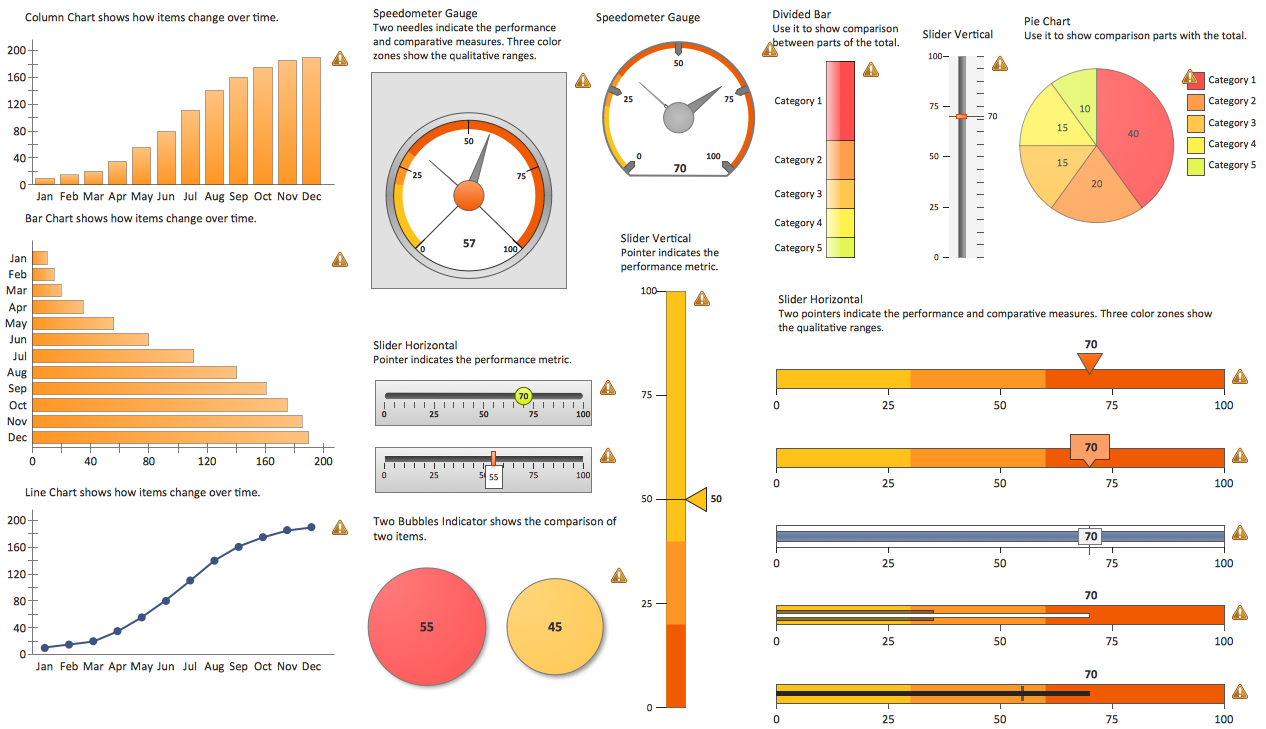
Picture: Sales Dashboards for Your Company
ConceptDraw
DIAGRAM 18