Sales Dashboard - Access Anywhere
Sales Dashboard Solution
ConceptDraw DIAGRAM is a software for making BI dashboards that provide effectiveness to your enterprise. The Sales Dashboard Solution allows managers to use live data to drive dashboards that show company performance in a wide variety of graphs. The clean and dynamic dashboard objects are driven by data files, and are updated automatically as the data changes. Dashboards allow you to capture and report specific data points from each department within the organization, thus providing a "snapshot" of performance.
Pic. 1. Sales Dashboard - Design Elements for mac
NINE RELATED HOW TO's:
To see how your business can improve you can try data visualization software solutions that allows you visualize all your sales KPI in one sales dashboard allows you monitor and analyse sales activities.
Picture: Data Visualization Software Solutions
This sample was created in ConceptDraw DIAGRAM diagramming and vector drawing software using the Pie Charts Solution from Graphs and Charts area of ConceptDraw Solution Park.
This sample shows the Pie Chart of the approximate air composition. You can see the percentage of oxygen, nitrogen and other gases in the air visualized on this Pie Chart.
Picture: Percentage Pie Chart. Pie Chart Examples
Related Solution:
ConceptDraw Sales Dashboard Solution is a simple and effective way of visualizing sales data and get clear picture of your sales process to see how your business can improve.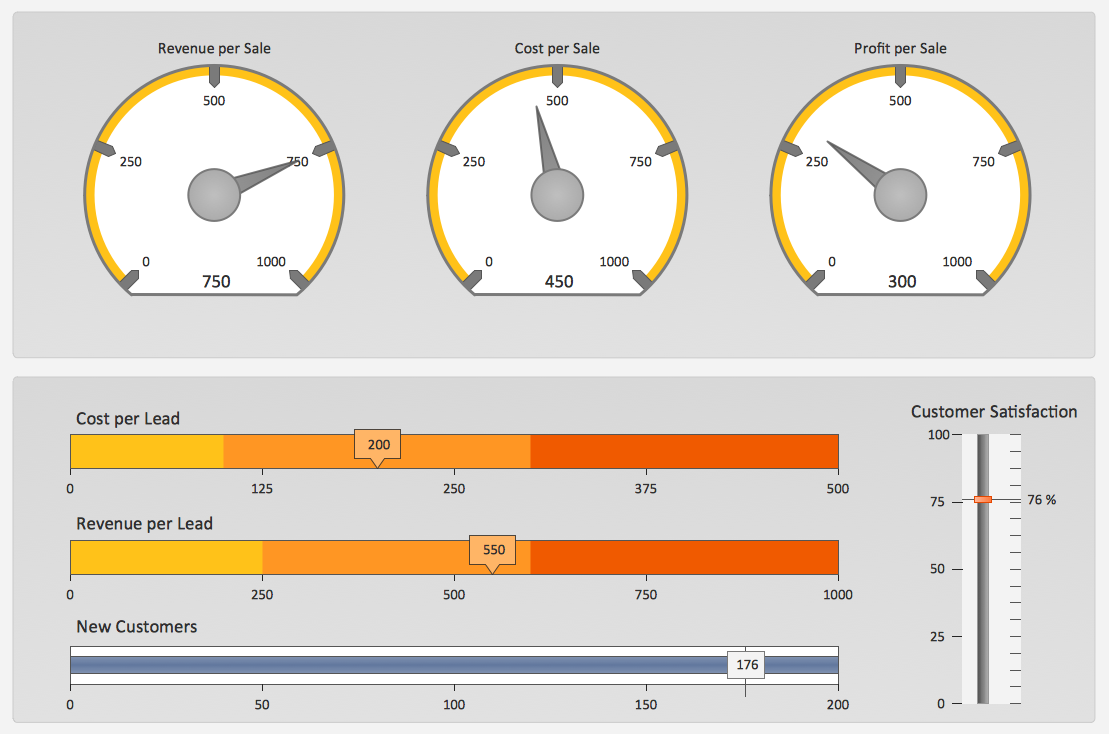
Picture: Sales Dashboard Solutionscan help your sales team keep an eye on performance
A mindmap illustrating a new restaurant's Twitter campaign.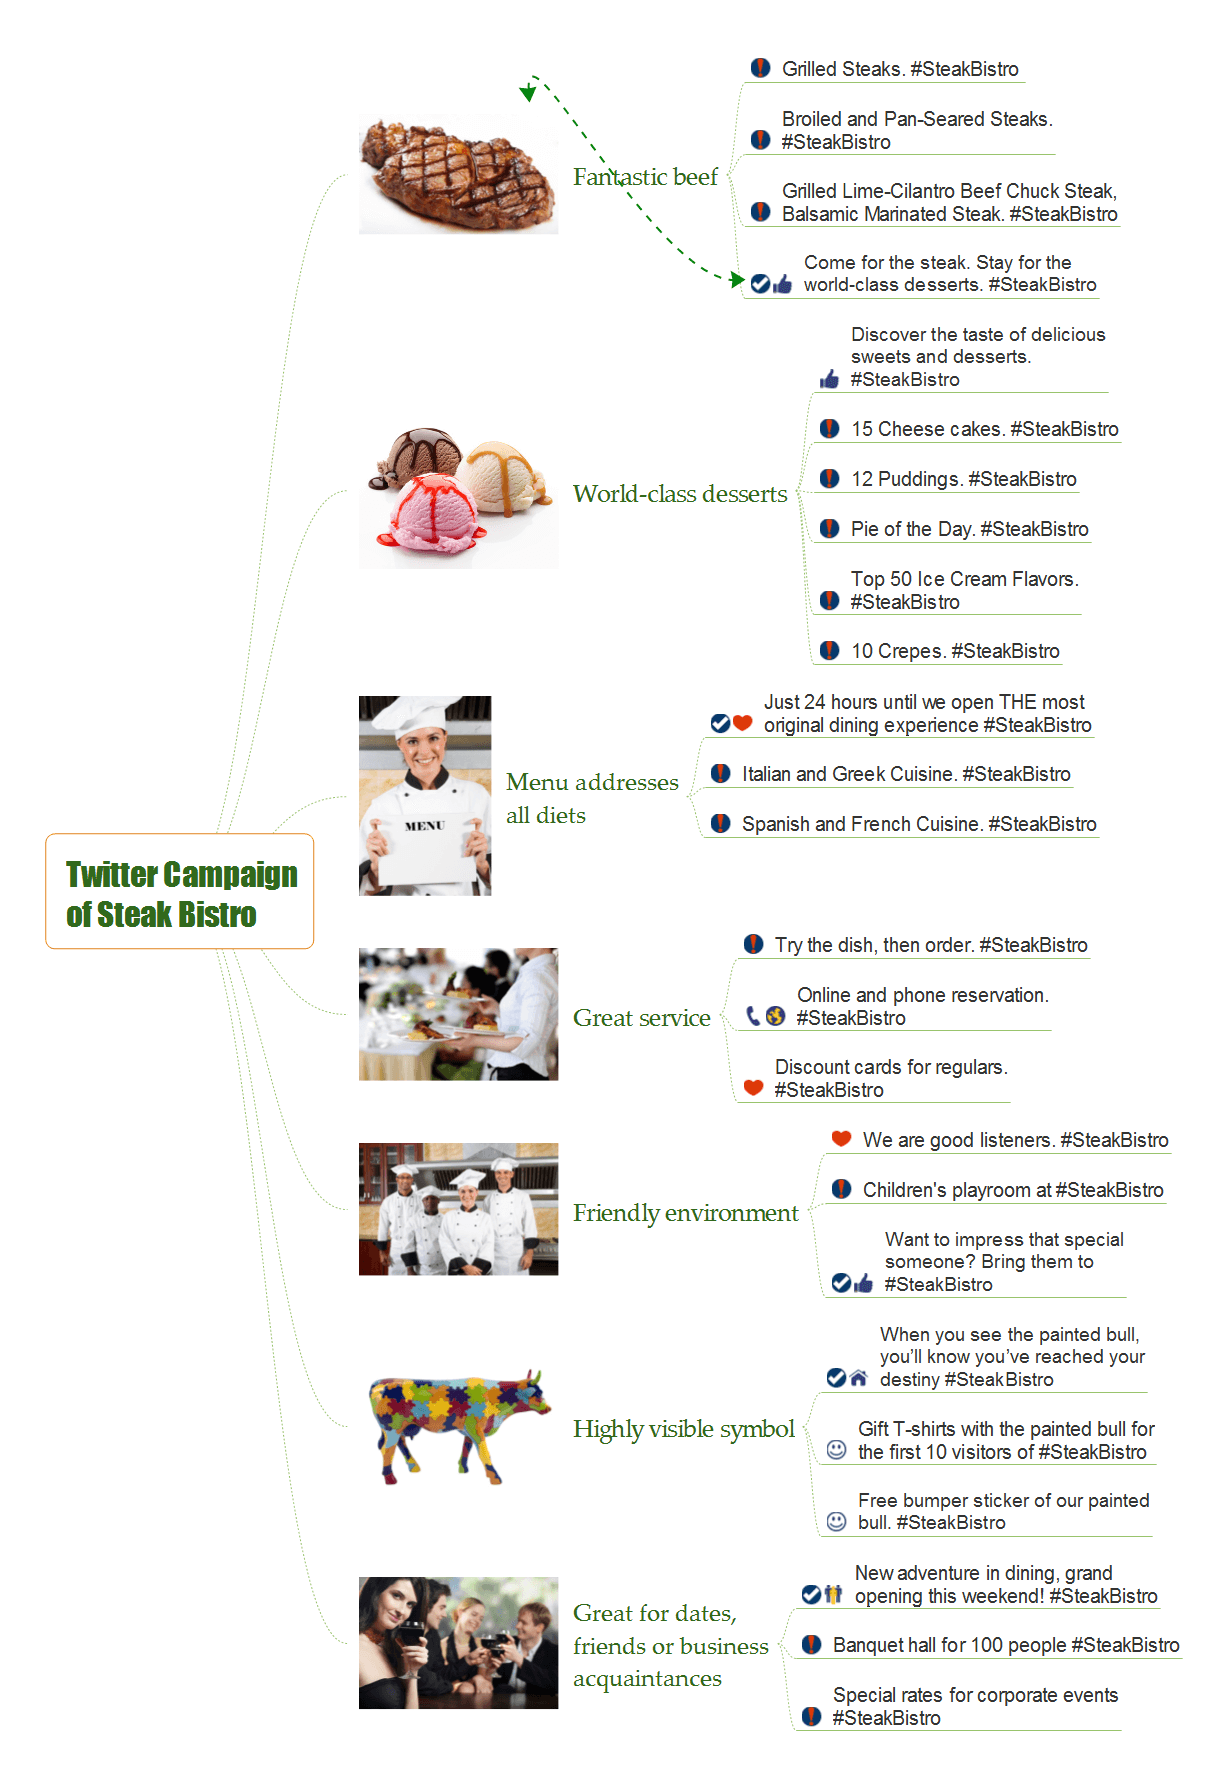
Picture: Promoting Restaurant
Related Solution:
Succeed in AWS architecture design, communication and collaboration with a team. 🔸 Create detailed and always up-to-date ✔️ AWS diagrams, ✔️ infrastructure based on AWS services, ✔️ auto-scalable architectures, ✔️ AWS-based applications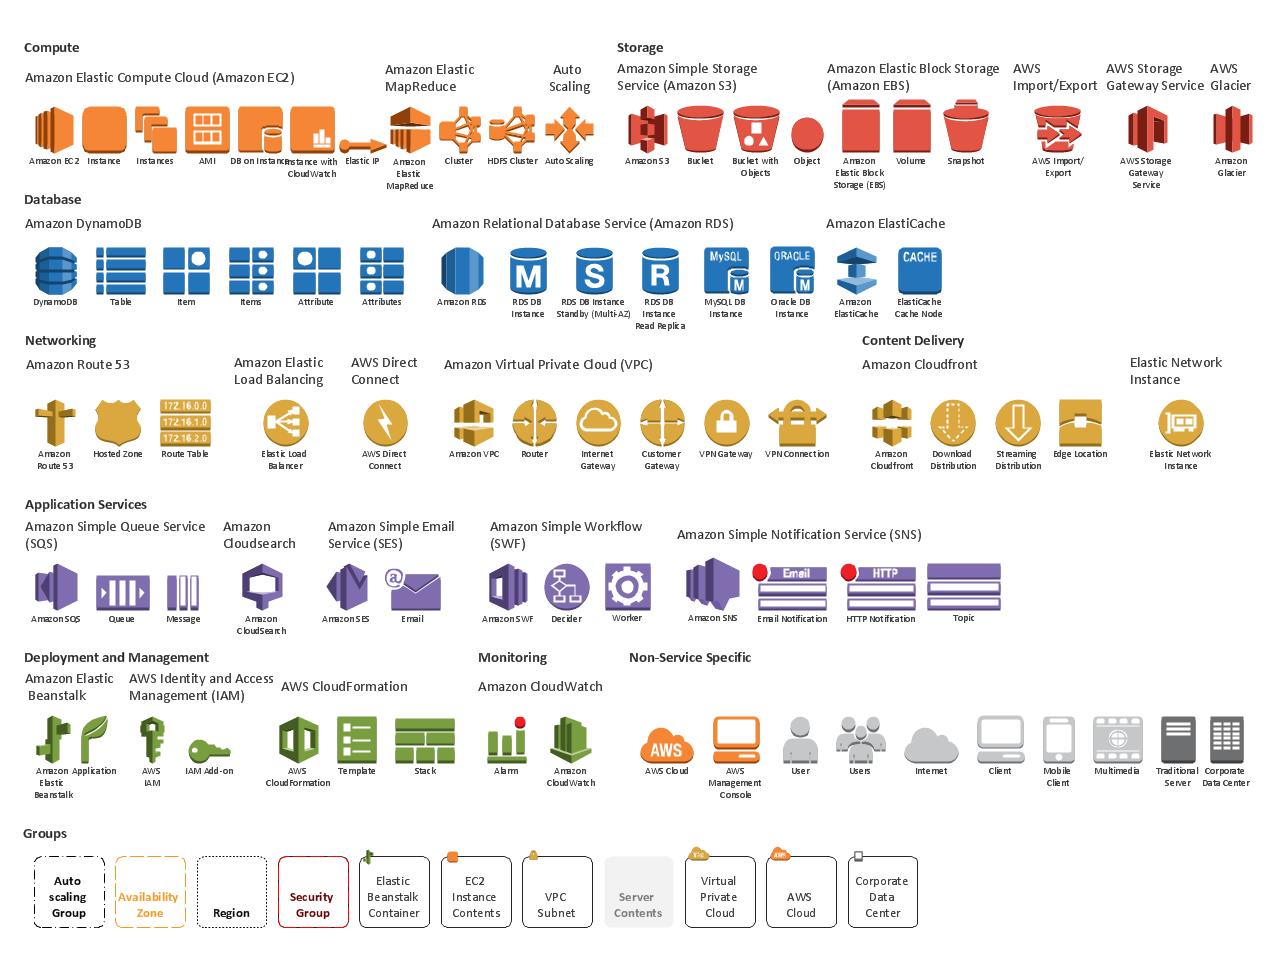
Picture: AWS icons 2.0
This sample was created in ConceptDraw DIAGRAM diagramming and vector drawing software using the Organizational Charts Solution from the Software Development area of ConceptDraw Solution Park.
This sample shows the organizational chart in the field of Architect Engineering. Create your own orgchart professional drawings using ConceptDraw.
Picture: Business Board Org Chart
Related Solution:
The first step to optimize a workflow is to get its visual depiction. Then you can analyse and optimize the workflow making changes to your workflow diagram. We recommend to use ConceptDraw DIAGRAM software extended with the Workflow Diagram solution to visualize and optimize your workflow. It allows you produce easy-to-change scalable vector graphic workflow and then present it to your team or partners.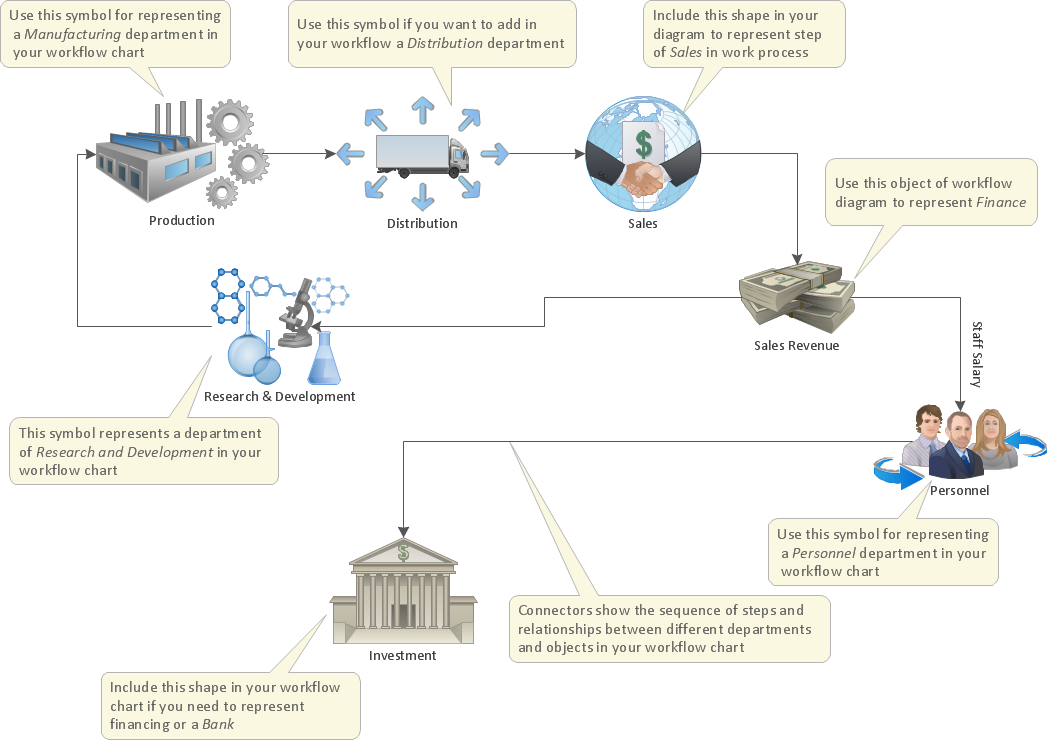
Picture: Optimize a Workflow
Related Solution:
Learn the most common process flowchart symbols used in business process diagrams and workflow charts. Includes symbol meanings, examples, and a practical reference table.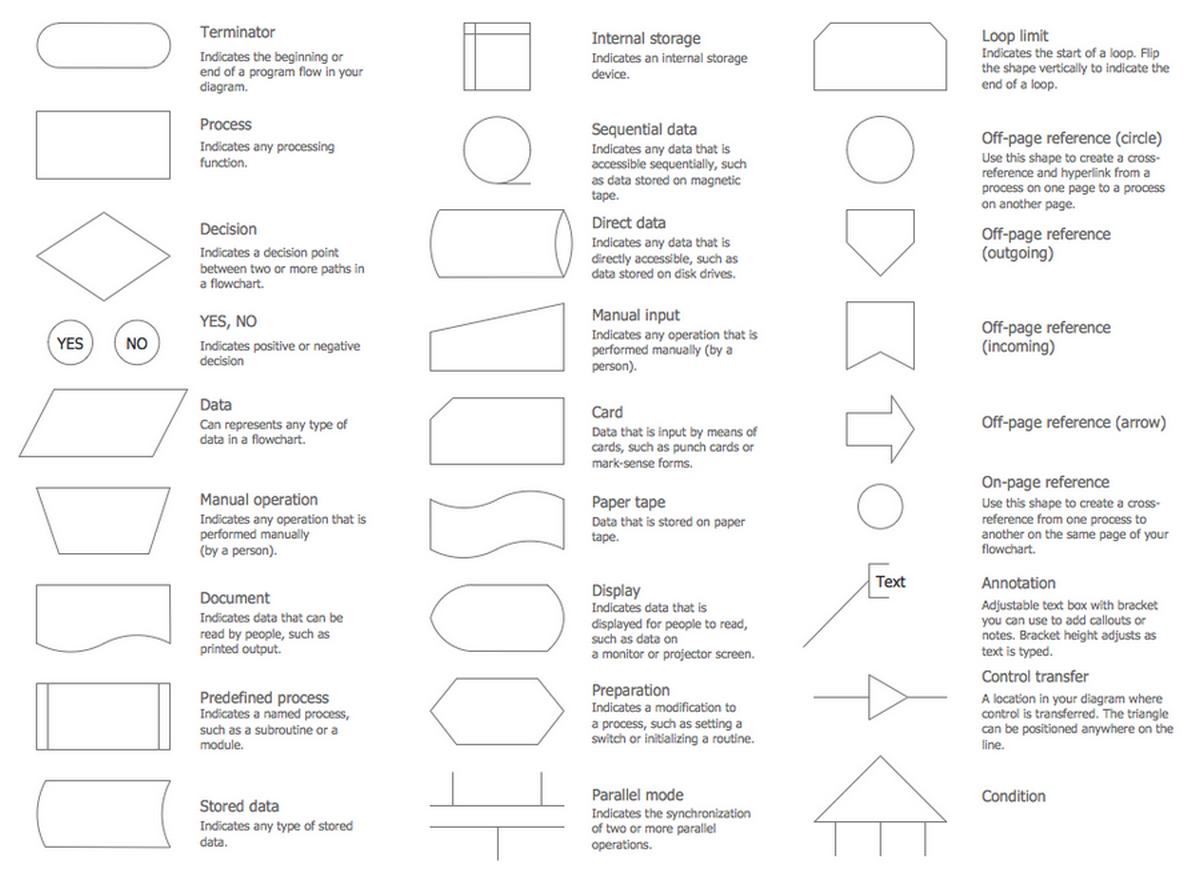
Picture: Process Flowchart Symbols: Meaning, Types and Examples
Related Solution:
ConceptDraw Sales Dashboard solution allows you empower your sales team with a sales dashboard that visualizes all team and personal KPI your team need to work effectively.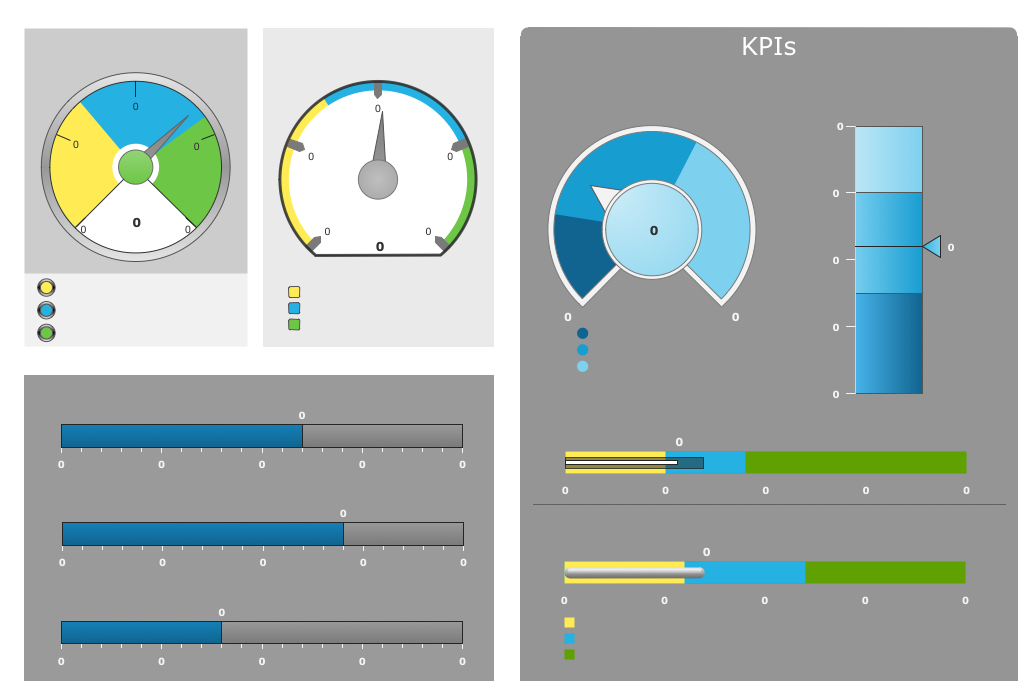
Picture: Empower Your Sales Team With a Sales Dashboard
ConceptDraw
DIAGRAM 18