Dashboard Software
Sales Dashboard Solution
ConceptDraw DIAGRAM is a dashboard software that provide effectiveness to your business. The Sales Dashboard Solution for ConceptDraw gives users the ability to use live data to drive dashborads that show performance in a wide variety of graphs. By using dashboards one obtain benefits:
- Measure efficiencies/inefficiencies
- Saves time compared to running multiple reports
- Gain total visibility of all systems instantly
Pic. 1. Sales Dashboard Design Elements (mac)
THREE RELATED HOW TO's:
The ConceptDraw DIAGRAM diagramming and vector drawing software provides the Cloud Computing Diagrams solution from the Computers and Network area of ConceptDraw Solution Park with powerful drawing tools and libraries containing large amount of predesigned vector objects for easy designing and displaying the structure of Amazon Cloud Computing Architecture.
Picture: Amazon Cloud Computing Architecture
Related Solution:
Using professional reporting and data visualization is the way your business can improve. ConceptDraw Sales Dashboard solution allows you produce live dashboards show KPI to monitor you sales activity and results in real time.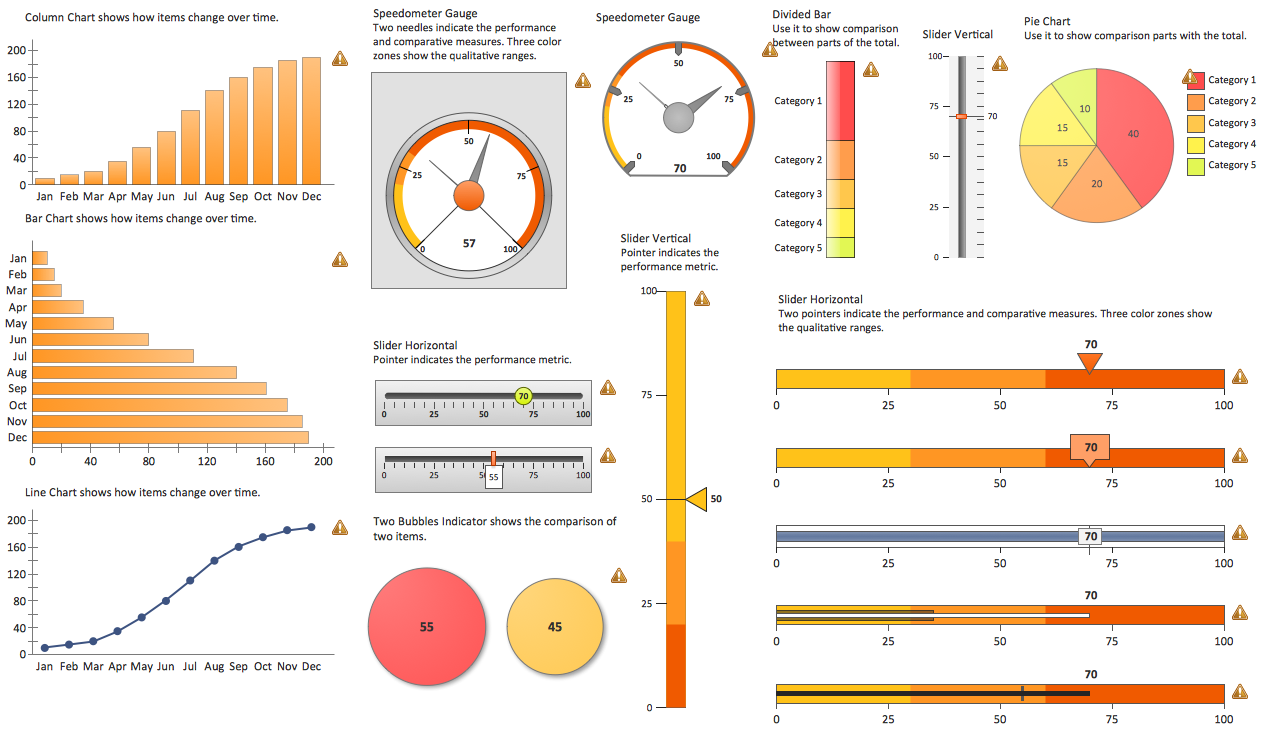
Picture: Reporting & Data Visualization
An effective way to improve your business is using reporting dashboard software. ConceptDraw DIAGRAM software extended with the Sales Dashboard solution helps you monitor all KPI on the one screen in real time.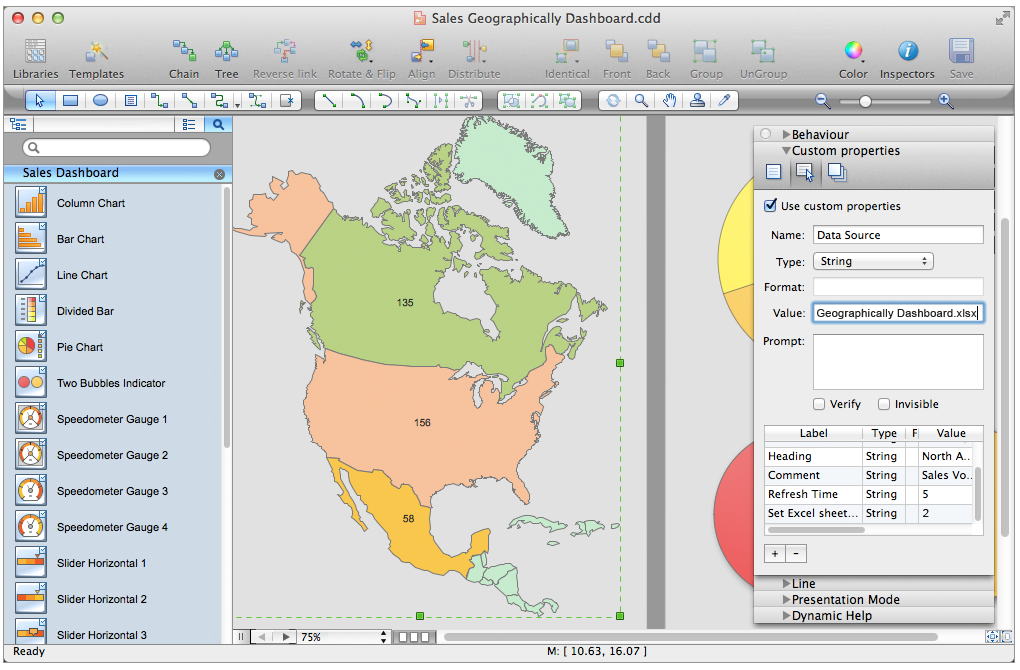
Picture: Reporting Dashboard Software for Business
ConceptDraw
DIAGRAM 18