 Logistic Dashboard
The powerful tools of Logistic Dashboard solution and specially developed live graphic objects of logistic icons, logistic navigation elements, logistic indicators, logistic charts and logistic maps effectively assist in designing Logistic dashboards, Logistic maps, Logistic charts, diagrams and infographics. The included set of prebuilt samples and quick-start templates, demonstrates the power of ConceptDraw DIAGRAM software in logistics management, its assisting abilities in development, realization and analyzing the logistic processes, as well as in perfection the methods of logistics management.
Sales Dashboard - Access Anywhere
Reporting Dashboard Software for Business
Dashboard Software
Sales Teams are Inherently Competitive
Business Intelligence Dashboard Software

The vector stencils library Comparison charts contains 4 Live Objects: Horizontal bar chart, Column chart (Vertical bar chart), Line chart and Dot plot (Scatter chart).
The vector stencils library Comparison indicators contains 7 Live Objects:
Two column indicator, Two bubbles indicator, Scales indicator, Left and right arrows indicator, Up and down arrows indicator, Two up arrows indicator.
The ConceptDraw Live Objects are ready-to-use templates of charts and visual indicators for dashboard design. You can set data source file for Each Live Object, and your charts or indicators will represents actual data from the data source files, and change their appearance with changing of the data in source files. The comparison charts and indicators are useful to compare and rank of your data by categories.
Use the design elements libraries "Comparison charts" and "Comparison indicators" to create your own business visual dashboards using the ConceptDraw PRO diagramming and vector drawing software.
The example "Design elements - Comparison charts and indicators" is included in the Comparison Dashboard solution from the area "What is a Dashboard" of ConceptDraw Solution Park.
Data comparison charts and visual indicators

Customer Relationship Management

The vector stencils library "Sales dashboard" contains 27 charts and indicators: bar charts, line graphs, gauges, sliders, pie charts, divided bar diagrams, bubble indicators, bullet indicators.
The design elements library "Sales dashboard" for the ConceptDraw PRO diagramming and vector drawing software is included in the Sales Dashboard solution from the Marketing area of ConceptDraw Solution Park.
The design elements library "Sales dashboard" for the ConceptDraw PRO diagramming and vector drawing software is included in the Sales Dashboard solution from the Marketing area of ConceptDraw Solution Park.
Sales dashboard charts and indicators

Reporting & Data Visualization

Sales Analytics
The vector stencils library "Meter indicators" contains 29 Live Objects: speedometer gauge, dial, bullet graph, slider and level meter visual indicators.
The Live Objects designed to display actual measures of performance metrics and KPIs from external data source files.
Some of them also display comparative measures, and colored zones of qualitative ranges with legend.
Use it to draw business performance dashboards using the ConceptDraw PRO diagramming and vector drawing software .
"Digital dashboards may be laid out to track the flows inherent in the business processes that they monitor. Graphically, users may see the high-level processes and then drill down into low level data. This level of detail is often buried deep within the corporate enterprise and otherwise unavailable to the senior executives. ...
Specialized dashboards may track all corporate functions. Examples include human resources, recruiting, sales, operations, security, information technology, project management, customer relationship management and many more departmental dashboards. ...
Like a car's dashboard (or control panel), a software dashboard provides decision makers with the input necessary to "drive" the business. Thus, a graphical user interface may be designed to display summaries, graphics (e.g., bar charts, pie charts, bullet graphs, "sparklines," etc.), and gauges (with colors similar to traffic lights) in a portal-like framework to highlight important information. ...
Digital dashboards allow managers to monitor the contribution of the various departments in their organization. To gauge exactly how well an organization is performing overall, digital dashboards allow you to capture and report specific data points from each department within the organization, thus providing a "snapshot" of performance." [Dashboard (management information systems). Wikipedia]
The example "Design elements - Meter indicators" is included in the Meter Dashboard solution from the area "What is a Dashboard" of ConceptDraw Solution Park.
Visual indicators

"Dashboards give signs about a business letting the user know something is wrong or something is right. ...
Balanced Scoreboards and Dashboards have been linked together as if they were interchangeable. However, although both visually display critical information, the difference is in the format: Scoreboards can open the quality of an operation while dashboards provide calculated direction. A balanced scoreboard has what they called a “prescriptive” format. It should always contain these components (Active Strategy) ...
(1) Perspectives – groupings of high level strategic areas.
(2) Objectives – verb-noun phrases pulled from a strategy plan.
(3) Measures – also called Metric or Key Performance Indicators (KPIs).
(4) Spotlight Indicators – red, yellow, or green symbols that provide an at-a-glance view of a measure’s performance.
Each of these sections ensures that a Balanced Scorecard is essentially connected to the businesses critical strategic needs.
The design of a dashboard is more loosely defined. Dashboards are usually a series of graphics, charts, gauges and other visual indicators that can be monitored and interpreted. Even when there is a strategic link, on a dashboard, it may not be noticed as such since objectives are not normally present on dashboards. However, dashboards can be customized to link their graphs and charts to strategic objectives." [Dashboard (business). Wikipedia]
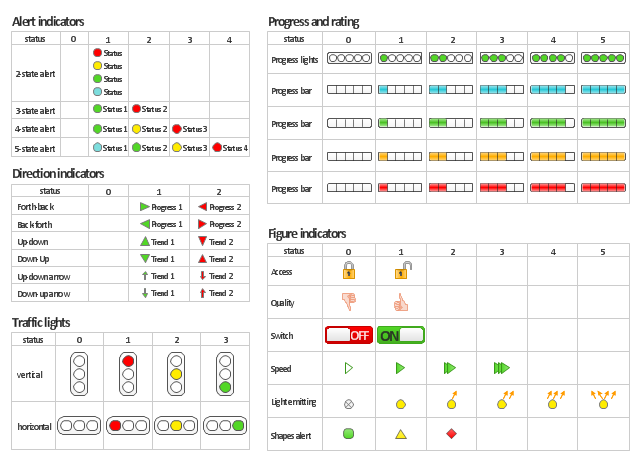
The vector stencils library "Status indicators" contains 41 visual status indicators for creating the business performance dashboards using the ConceptDraw PRO diagramming and vector drawing software.
Each status indicator can visualize one of 2-6 information states and have a caption.
Status indicators allow you quickly estimate, where your immediate decision and action is critical.
The example "Design elements - Status indicators" is included in the Status Dashboard solution from the area "What is a Dashboard" of ConceptDraw Solution Park.
Balanced Scoreboards and Dashboards have been linked together as if they were interchangeable. However, although both visually display critical information, the difference is in the format: Scoreboards can open the quality of an operation while dashboards provide calculated direction. A balanced scoreboard has what they called a “prescriptive” format. It should always contain these components (Active Strategy) ...
(1) Perspectives – groupings of high level strategic areas.
(2) Objectives – verb-noun phrases pulled from a strategy plan.
(3) Measures – also called Metric or Key Performance Indicators (KPIs).
(4) Spotlight Indicators – red, yellow, or green symbols that provide an at-a-glance view of a measure’s performance.
Each of these sections ensures that a Balanced Scorecard is essentially connected to the businesses critical strategic needs.
The design of a dashboard is more loosely defined. Dashboards are usually a series of graphics, charts, gauges and other visual indicators that can be monitored and interpreted. Even when there is a strategic link, on a dashboard, it may not be noticed as such since objectives are not normally present on dashboards. However, dashboards can be customized to link their graphs and charts to strategic objectives." [Dashboard (business). Wikipedia]
The vector stencils library "Status indicators" contains 41 visual status indicators for creating the business performance dashboards using the ConceptDraw PRO diagramming and vector drawing software.
Each status indicator can visualize one of 2-6 information states and have a caption.
Status indicators allow you quickly estimate, where your immediate decision and action is critical.
The example "Design elements - Status indicators" is included in the Status Dashboard solution from the area "What is a Dashboard" of ConceptDraw Solution Park.
Visual status indicators
Business Graphics Software
 Business Intelligence Dashboard
Business Intelligence Dashboard solution extends the ConceptDraw DIAGRAM functionality with exclusive tools, numerous ready-to-use vector objects, samples and quick-start templates for creation professional Business Intelligence Dashboards, Business Intelligence Graphics, Business Intelligence Charts and Maps of different kinds. Design easy the BI dashboard, BI model or Dynamic chart in ConceptDraw DIAGRAM to monitor the company's work, to track the indicators corresponding your company's data, to display and analyze key performance indicators, to evaluate the trends and regularities of the processes occurring at the company.
 HR Dashboard
The HR Dashboard solution extends ConceptDraw DIAGRAM functionality with powerful drawing tools and great collection of comprehensive vector design elements, icons, pictograms and objects, navigation elements, live objects of HR charts, HR indicators, and thematic maps. The range of HR Dashboards applications is extensive, among them the human resource management, recruitment, hiring process, human resource development. ConceptDraw DIAGRAM software is perfect for creation HR Dashboard with any goal you need. It gives you all opportunities for designing not only informative, but also professional looking and attractive HR Dashboards of any style and degree of detalization, that are perfect for using in presentations, reports and other thematic documents.
 Sales Dashboard
Sales Dashboard solution extends ConceptDraw DIAGRAM software with templates, samples and library of vector stencils for drawing the visual dashboards of sale metrics and key performance indicators (KPI).
The vector stencils library "Sales dashboard" contains 27 charts and indicators: bar charts, line graphs, gauges, sliders, pie charts, divided bar diagrams, bubble indicators, bullet indicators.
The design elements library "Sales dashboard" for the ConceptDraw PRO diagramming and vector drawing software is included in the Sales Dashboard solution from the Marketing area of ConceptDraw Solution Park.
The design elements library "Sales dashboard" for the ConceptDraw PRO diagramming and vector drawing software is included in the Sales Dashboard solution from the Marketing area of ConceptDraw Solution Park.
Sales dashboard charts and indicators
The vector stencils library "Sales KPIs and Metrics" contains 15 chart templates and graphic indicators of sales key performance indicators (KPIs) and metrics for drawing sales dashboards: line charts "Cost per order" and "Clicks from Sales Follow-Up Emails", column charts "Social Media Usage" and "Usage Rate of Marketing Collateral", horizontal bar charts "Rate of Follow Up Contact", "Cost per customer" and "Lead Response Time", pie charts "Product mix", "Product Performance" and "Rate of Contact", gauge (speedometer) indicators "Sales Growth" and "Actual vs Plan", bullet indicator "Sales Target", diamond alarm indicators "Average Purchase Value", "Quote to Close Ratio", "Opportunity-to-Win Ratio" and "Sales Ratio".
The dashboard charts and indicators example "Design elements - Sales KPIs and metrics" for the ConceptDraw PRO diagramming and vector drawing software is included in the Sales Dashboard solution from the Marketing area of ConceptDraw Solution Park.
www.conceptdraw.com/ solution-park/ marketing-sales-dashboard
Sales dashboard charts and graphic indicators

"A thematic map is a type of map or chart especially designed to show a particular theme connected with a specific geographic area. ...
A thematic map is a map that focuses on a specific theme or subject area, whereas in a general map the variety of phenomena - geological, geographical, political - regularly appear together. ...
Thematic maps emphasize spatial variation of one or a small number of geographic distributions. These distributions may be physical phenomena such as climate or human characteristics such as population density and health issues. ...
Thematic map are sometimes referred to as graphic essays that portray spatial variations and interrelationships of geographical distributions. Location, of course, is important to provide a reference base of where selected phenomena are occurring. ...
Thematic maps serve three primary purposes.
First, they provide specific information about particular locations.
Second, they provide general information about spatial patterns.
Third, they can be used to compare patterns on two or more maps." [Thematic map. Wikipedia]
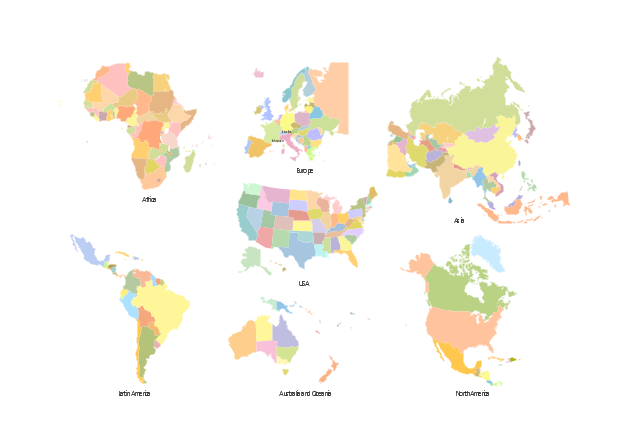
The vector stencils library "Thematic maps" contains 7 continent map contours for creating the thematic maps of geographic regions displaying the metric values by countries, states and territories marked by different colors.
Use the design elements library "Thematic maps" to create spatial dashboards using the ConceptDraw PRO diagramming and vector drawing software for your Spatial Intelligence and Location Intelligence business practice.
The example "Design elements - Thematic maps" is included in the Spatial Dashboard solution from the area "What is a Dashboard" of ConceptDraw Solution Park.
A thematic map is a map that focuses on a specific theme or subject area, whereas in a general map the variety of phenomena - geological, geographical, political - regularly appear together. ...
Thematic maps emphasize spatial variation of one or a small number of geographic distributions. These distributions may be physical phenomena such as climate or human characteristics such as population density and health issues. ...
Thematic map are sometimes referred to as graphic essays that portray spatial variations and interrelationships of geographical distributions. Location, of course, is important to provide a reference base of where selected phenomena are occurring. ...
Thematic maps serve three primary purposes.
First, they provide specific information about particular locations.
Second, they provide general information about spatial patterns.
Third, they can be used to compare patterns on two or more maps." [Thematic map. Wikipedia]
The vector stencils library "Thematic maps" contains 7 continent map contours for creating the thematic maps of geographic regions displaying the metric values by countries, states and territories marked by different colors.
Use the design elements library "Thematic maps" to create spatial dashboards using the ConceptDraw PRO diagramming and vector drawing software for your Spatial Intelligence and Location Intelligence business practice.
The example "Design elements - Thematic maps" is included in the Spatial Dashboard solution from the area "What is a Dashboard" of ConceptDraw Solution Park.
Thematic map templates
- Design elements - Sales dashboard | Sales Dashboard - Access ...
- Dashboard Design Templates Columns And Pie
- Comparison Dashboard | Design elements - Comparison charts and ...
- Real Time Dashboard Design
- Meter Dashboard | Design elements - Sales dashboard | How to ...
- Logistic Dashboard | ConceptDraw DIAGRAM Compatibility with MS ...
- Design elements - Composition charts and indicators | Basic Pie ...
- Android Dashboard Design Example
- Frequency distribution charts - Vector stencils library | Design ...
- Design elements - Status indicators | Status Dashboard | iPhone OS ...
- Logistic Dashboard | Diagramming Software for Design UML Activity ...
- Correlation Dashboard | Correlation dashboard - Template | Design ...
- Design elements - Comparison charts and indicators | Comparison ...
- HR Flowcharts | Design elements - Meter indicators | How to Create ...
- Comparison indicators - Vector stencils library | Design elements ...
- What is a Dashboard Area | Dashboard Software
- Time Series Dashboard | Design elements - Time series charts ...
- Android User Interface | Food Court | PM Dashboards | Android ...
- KPI Dashboard | Dashboard Software | What is a KPI? | Dashboard ...