"Dashboards give signs about a business letting the user know something is wrong or something is right. ...
Balanced Scoreboards and Dashboards have been linked together as if they were interchangeable. However, although both visually display critical information, the difference is in the format: Scoreboards can open the quality of an operation while dashboards provide calculated direction. A balanced scoreboard has what they called a “prescriptive” format. It should always contain these components (Active Strategy) ...
(1) Perspectives – groupings of high level strategic areas.
(2) Objectives – verb-noun phrases pulled from a strategy plan.
(3) Measures – also called Metric or Key Performance Indicators (KPIs).
(4) Spotlight Indicators – red, yellow, or green symbols that provide an at-a-glance view of a measure’s performance.
Each of these sections ensures that a Balanced Scorecard is essentially connected to the businesses critical strategic needs.
The design of a dashboard is more loosely defined. Dashboards are usually a series of graphics, charts, gauges and other visual indicators that can be monitored and interpreted. Even when there is a strategic link, on a dashboard, it may not be noticed as such since objectives are not normally present on dashboards. However, dashboards can be customized to link their graphs and charts to strategic objectives." [Dashboard (business). Wikipedia]
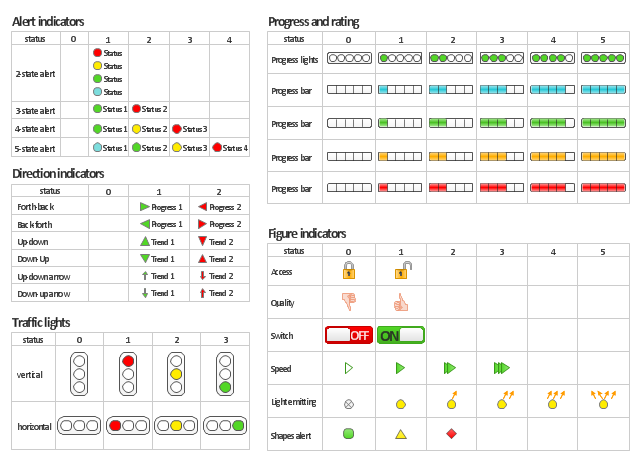
The vector stencils library "Status indicators" contains 41 visual status indicators for creating the business performance dashboards using the ConceptDraw PRO diagramming and vector drawing software.
Each status indicator can visualize one of 2-6 information states and have a caption.
Status indicators allow you quickly estimate, where your immediate decision and action is critical.
The example "Design elements - Status indicators" is included in the Status Dashboard solution from the area "What is a Dashboard" of ConceptDraw Solution Park.
 Status Dashboard
Status dashboard solution extends ConceptDraw PRO software with templates, samples and vector stencils libraries with graphic indicators for drawing the visual dashboards showing status data.
"Smaller mobile devices such as PDAs and smartphones typically use the WIMP elements with different unifying metaphors, due to constraints in space and available input devices. Applications for which WIMP is not well suited may use newer interaction techniques, collectively named as post-WIMP user interfaces.
As of 2011, some touch-screen-based operating systems such as Apple's iOS (iPhone) and Android use the class of GUIs named post-WIMP. These support styles of interaction using more than one finger in contact with a display, which allows actions such as pinching and rotating, which are unsupported by one pointer and mouse." [Graphical user interface. Wikipedia]
"In computing post-WIMP comprises work on user interfaces, mostly graphical user interfaces, which attempt to go beyond the paradigm of windows, icons, menus and a pointing device, i.e. WIMP interfaces. ...
However WIMP interfaces are not optimal for working with complex tasks such as computer-aided design, working on large amounts of data simultaneously, or interactive games. WIMPs are usually pixel-hungry, so given limited screen real estate they can distract attention from the task at hand. Thus, custom interfaces can better encapsulate workspaces, actions, and objects for specific complex tasks. Applications for which WIMP is not well suited include those requiring continuous input signals, showing 3D models, or simply portraying an interaction for which there is no defined standard widget.
Interfaces based on these considerations, now called "post-WIMP", have made their way to the general public. Examples include the interface of the classic MP3 player iPod and a bank's automated teller machine screen." [Post-WIMP. Wikipedia]
The example "iPhone OS (iOS) graphic user interface (GUI) - Activity indicator view" was created using the ConceptDraw PRO diagramming and vector drawing software extended with the Graphic User Interface solution from the Software Development area of ConceptDraw Solution Park.
 What is a Dashboard Area
Solutions from the area What is a Dashboard of ConceptDraw Solution Park collects templates, samples and vector stencils libraries with of data driven charts and indicators for drawing the basic types of Visual Dashboards.
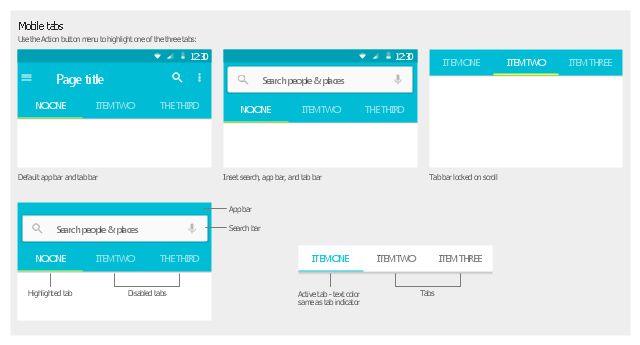
The vector stencils library "Android tabs" contains 9 tab elements: app bar, tab bar, search bar, tabs.
Use it to design user interface of your Android 5 application.
The shapes example "Design elements - Android tabs" was created using the ConceptDraw PRO diagramming and vector drawing software extended with the "Android user interface" solution from the "Software Development" area of ConceptDraw Solution Park.
Dashboard
ConceptDraw PRO extended with Sales Dashboard solution from the Marketing area of ConceptDraw Solution Park is a perfect software for creating the live dashboard for the business data and progress visualization.Product Overview
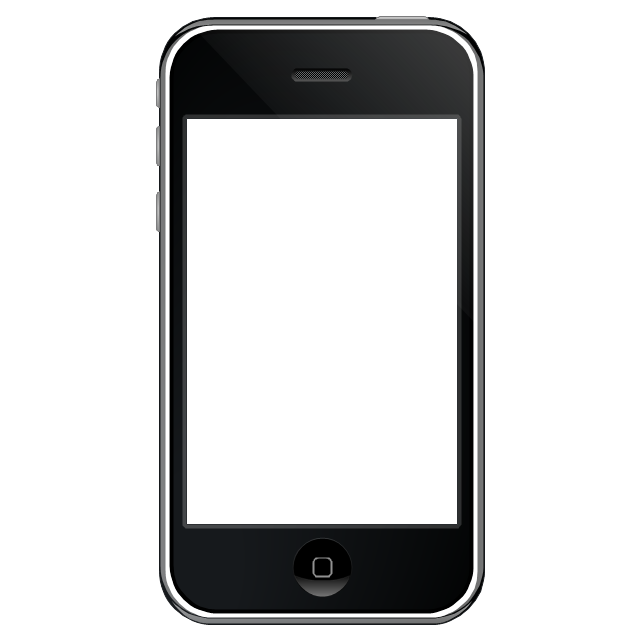
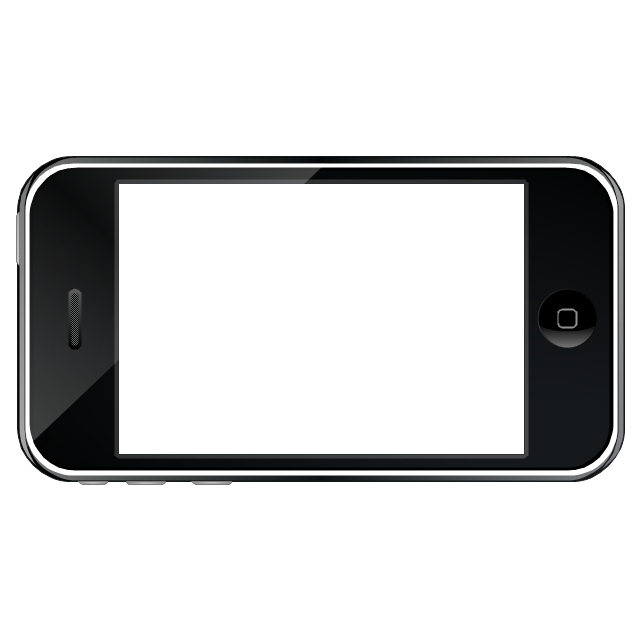
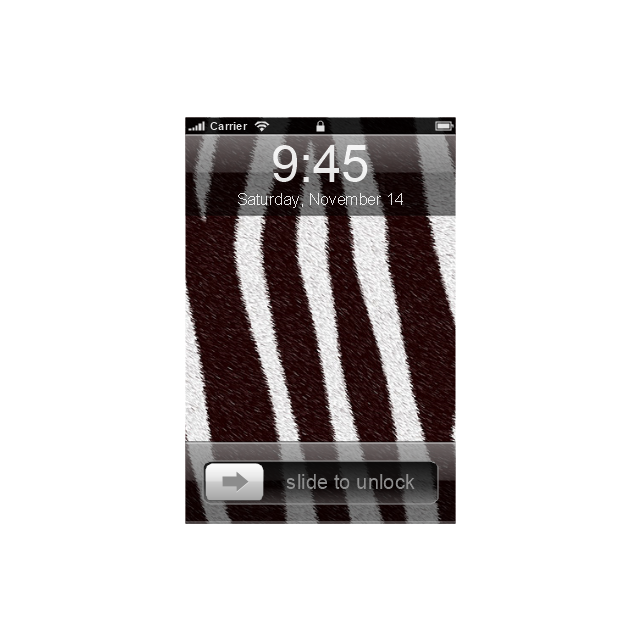
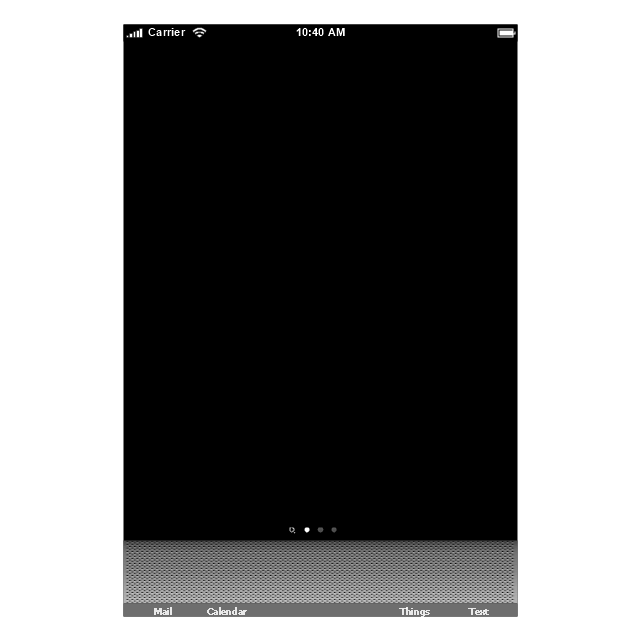
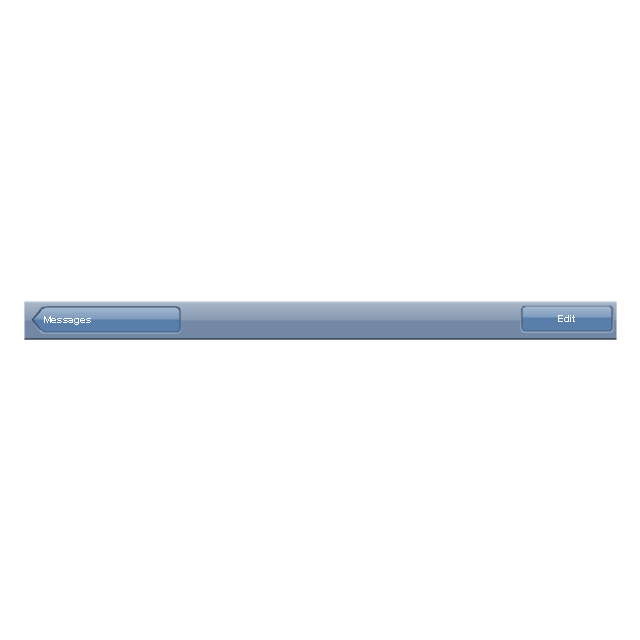
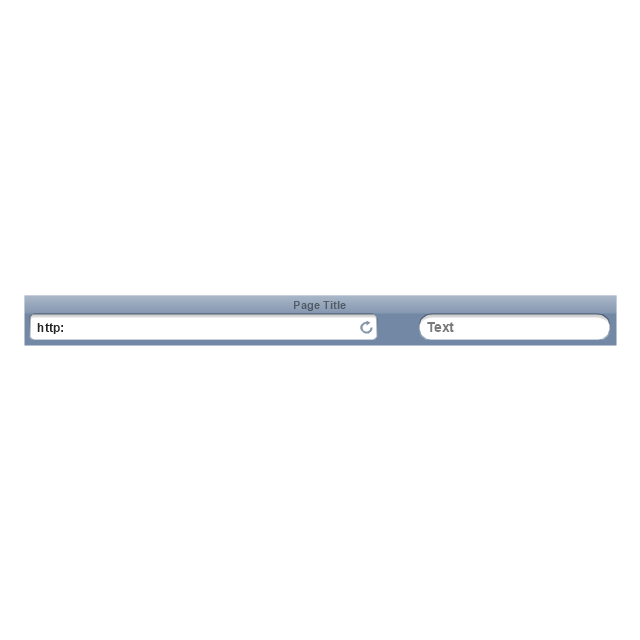
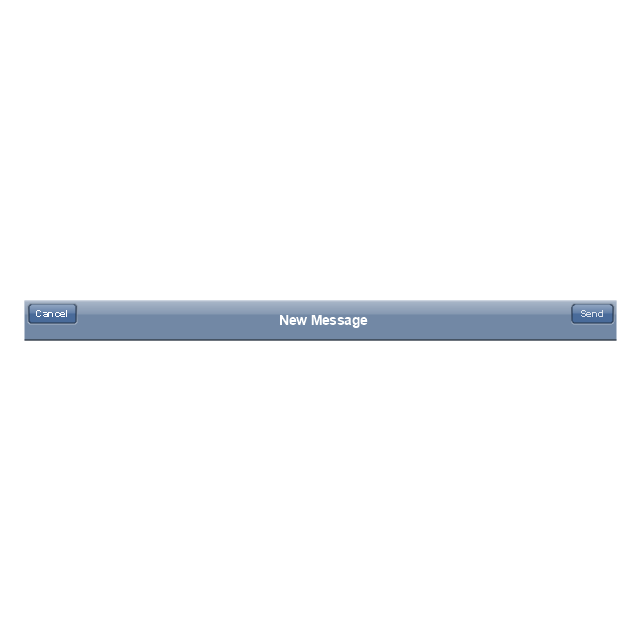
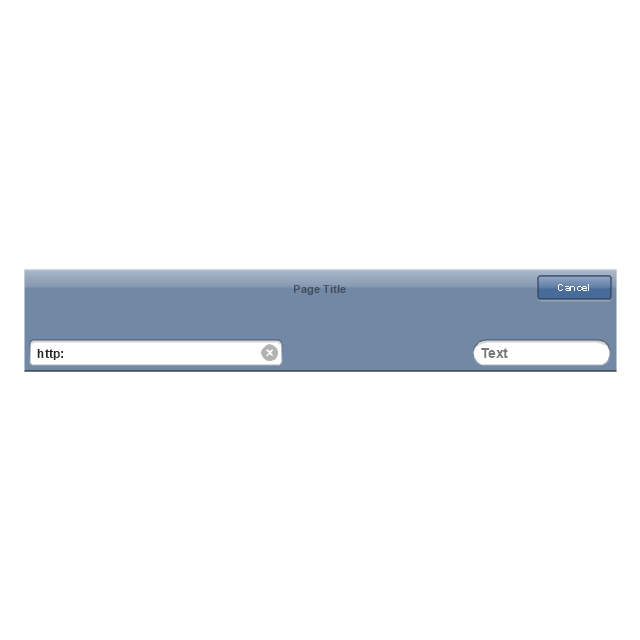
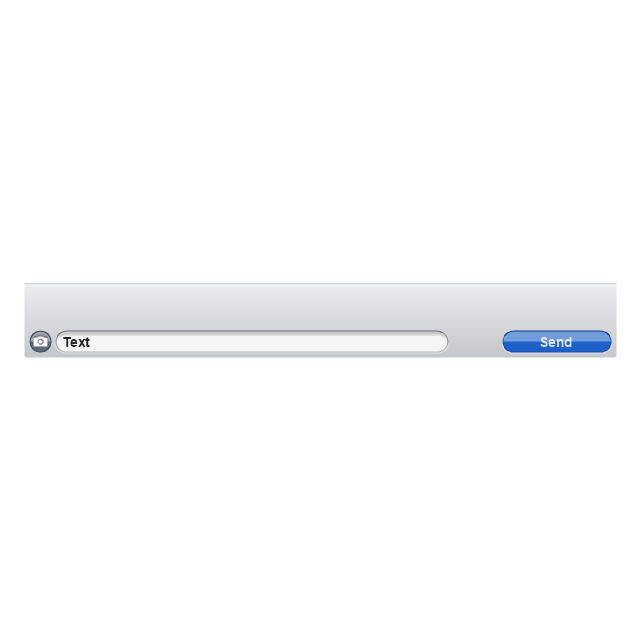
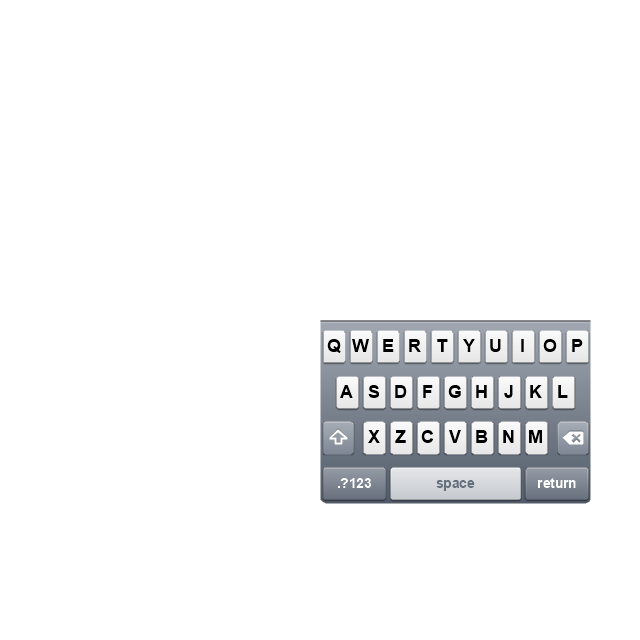
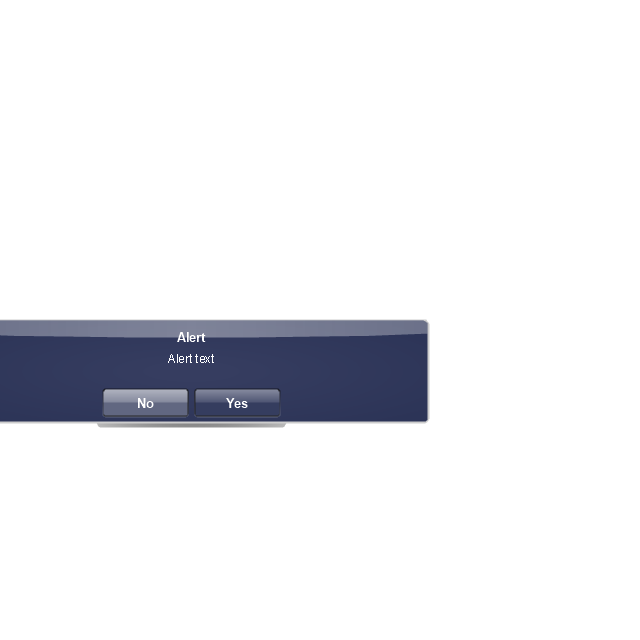
ConceptDraw PRO offers a wide choice of powerful and easy-to-use tools for quickly creating all kinds of charts and diagrams. Even if you've never used a drawing tool before, it's very easy to create high-quality professional graphic documents with ConceptDraw PRO.The vector stencils library "iPhone interface" contains 119 iPhone UI design elements.
Use it for development of graphic user interface (GUI) for iPhone software applications in the ConceptDraw PRO diagramming and vector drawing software extended with the Graphic User Interface solution from the Software Development area of ConceptDraw Solution Park.
Use it for development of graphic user interface (GUI) for iPhone software applications in the ConceptDraw PRO diagramming and vector drawing software extended with the Graphic User Interface solution from the Software Development area of ConceptDraw Solution Park.
 PM Dashboards
This solution extends ConceptDraw PRO and ConceptDraw PROJECT software with the ability to clearly display the identified key performance indicators for any project.
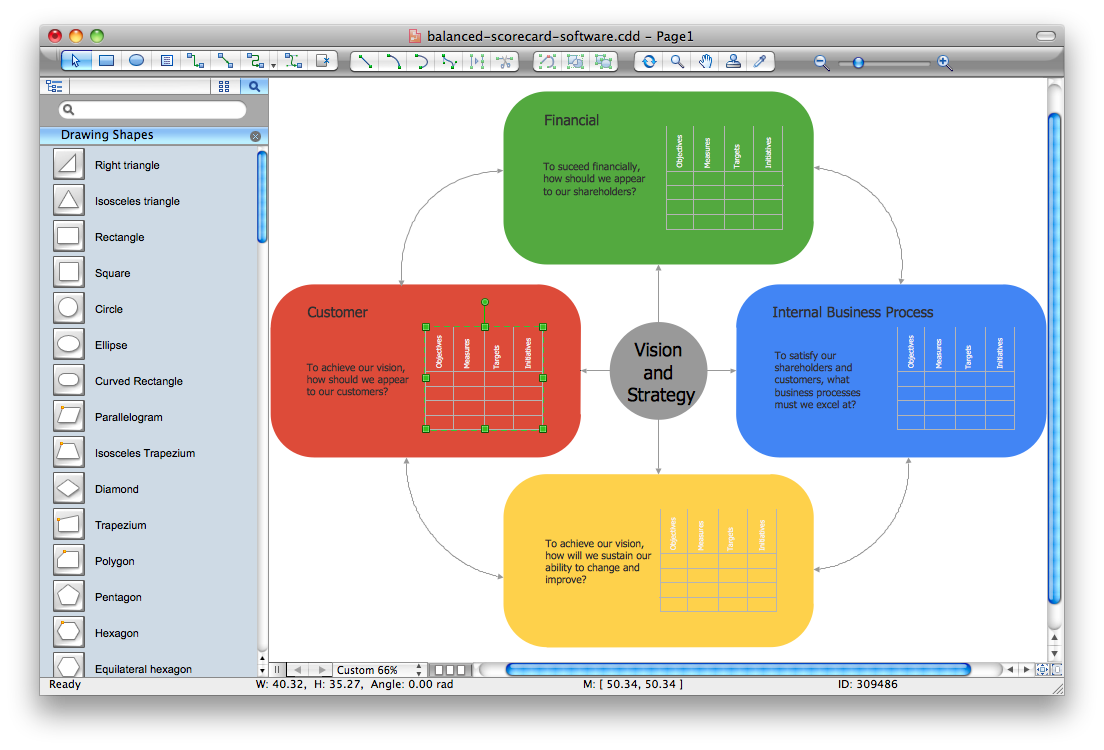
Balanced Scorecard Software
Balanced Scorecard Software provide incredible large variety of samples, templates and libraries of predesigned vector objects. Nothing could be easy that use the predesigned template and fill it, and simply drag the ready-to-use objects for designing your own balanced scorecard diagram.
 What are Infographic Area
Solutions of the area What is Infographics from ConceptDraw Solution Park collect templates, samples and vector stencils libraries with design elements for the drawing information graphics.
 Sales Dashboard
Sales Dashboard solution extends ConceptDraw PRO software with templates, samples and library of vector stencils for drawing the visual dashboards of sale metrics and key performance indicators (KPI).
- Design elements - Status indicators
- Design elements - Status indicators | Status indicators - Vector ...
- Design elements - Status indicators | Design elements - Meter ...
- Design elements - Status indicators | Status Dashboard | iPhone OS ...
- Design elements - Status indicators | How To Hold Project ...
- Performance Indicators | Enterprise dashboard | KPI Dashboard ...
- Flowchart design . Flowchart symbols, shapes, stencils and icons ...
- Performance Indicators | Design elements - Comparison charts and ...
- Status indicators - Vector stencils library | Status Dashboard | Project ...
- Performance Indicators | Enterprise dashboard | Design elements ...
- Performance Indicators | Comparison indicators - Vector stencils ...
- Mac OS X user interface - Vector stencils library | Status indicators ...
- Performance Indicators | | | Dashboard Indicator
- Quality Status Indicator Graphics
- Export from ConceptDraw PRO Document to PDF (Adobe Acrobat®)
- Finite State Machine | UML Diagram | Status indicators - Vector ...
- Status indicators
- Status Dashboard | Road Transport - Design Elements | Aerospace ...
- Composition indicators - Vector stencils library | Design elements ...
- Status Dashboard | PM Dashboards | Meter Dashboard | Free ...
-graphic-user-interface-(gui)---activity-indicator-view.png--diagram-flowchart-example.png)









-iphone-interface---vector-stencils-library.png--diagram-flowchart-example.png)
-iphone-interface---vector-stencils-library.png--diagram-flowchart-example.png)











-iphone-interface---vector-stencils-library.png--diagram-flowchart-example.png)


-iphone-interface---vector-stencils-library.png--diagram-flowchart-example.png)
-iphone-interface---vector-stencils-library.png--diagram-flowchart-example.png)
-iphone-interface---vector-stencils-library.png--diagram-flowchart-example.png)
-iphone-interface---vector-stencils-library.png--diagram-flowchart-example.png)

