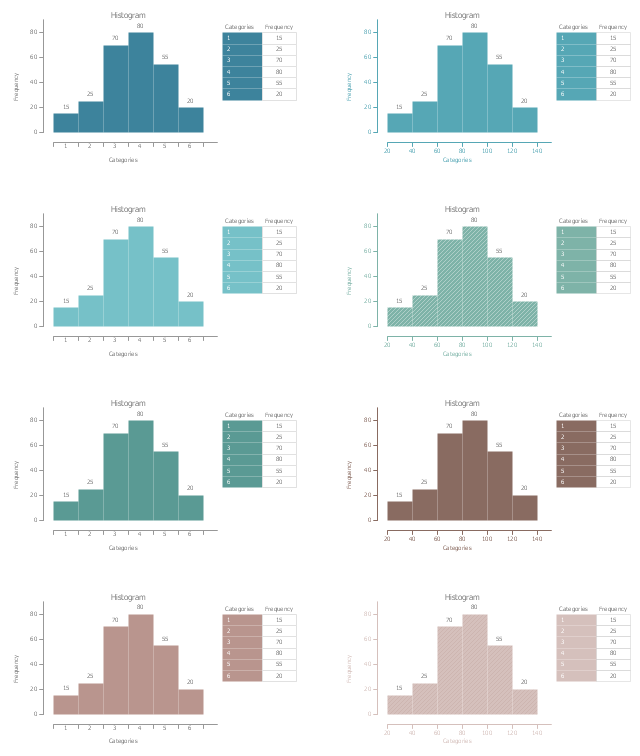
The vector stencils library "Histograms" contains 8 templates of histograms for visualizing frequency distribution data.
Drag a template from the library to your document and enter your data.
Use these shapes to draw your histograms in ConceptDraw PRO diagramming and vector drawing software.
The vector stencils library "Histograms" is included in the Histograms solution from the Graphs and Charts area of ConceptDraw Solution Park.
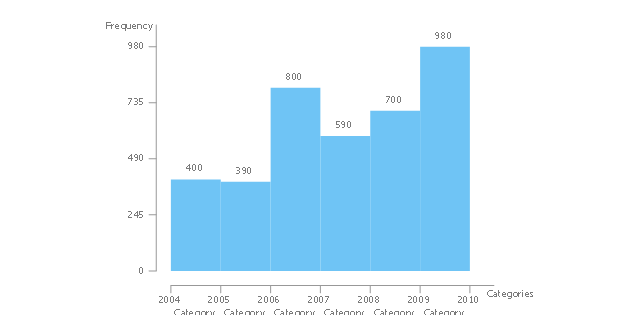
Frequency histogram
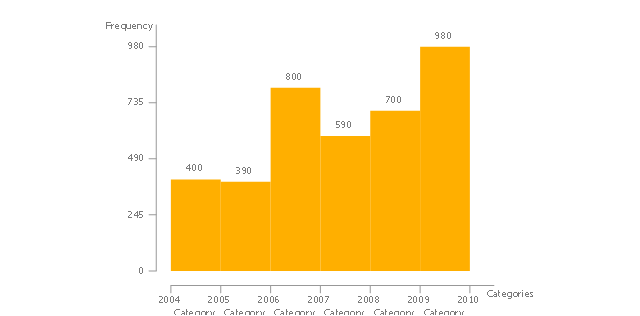
Frequency histogram 2
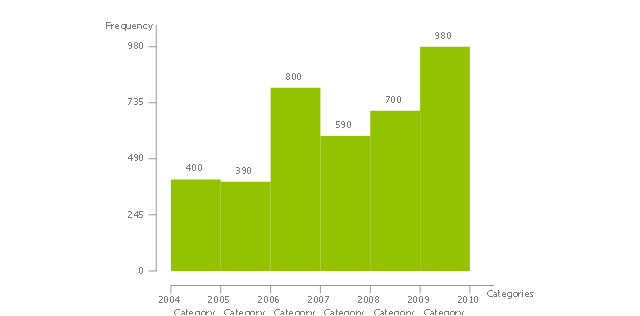
Frequency histogram 3
Frequency histogram (table)
-histograms---vector-stencils-library.png--diagram-flowchart-example.png)
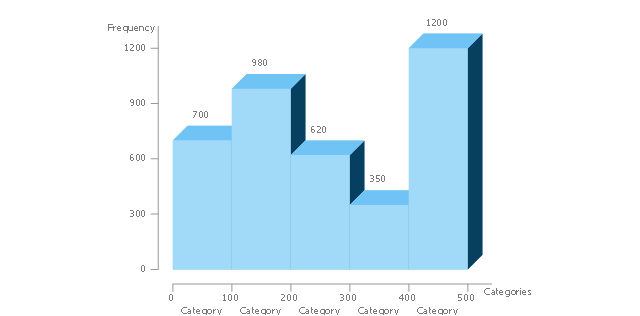
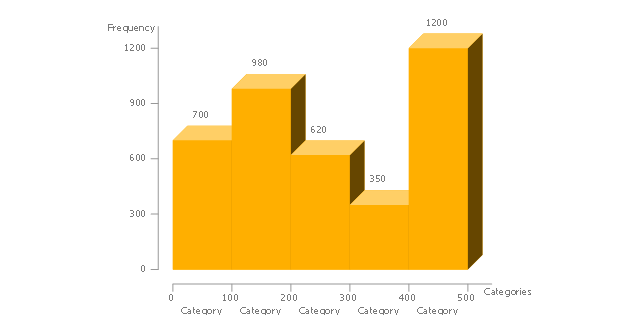
3D frequency histogram
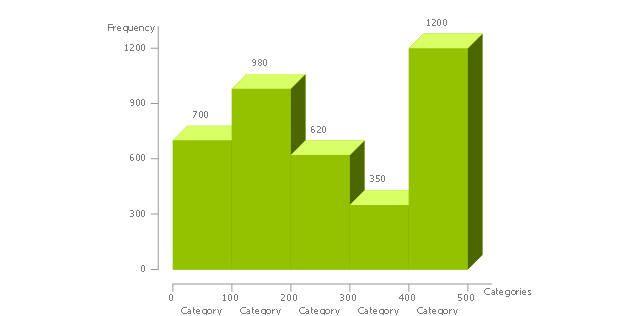
3D frequency histogram 2
3D frequency histogram 3
3D frequency histogram (table)
-histograms---vector-stencils-library.png--diagram-flowchart-example.png)
Chart Examples

The vector stencils library "Histogram" contains 8 templates of histogram.
Use it to design your histograms with ConceptDraw PRO diagramming and vector drawing software.
"A histogram is a graphical representation of the distribution of numerical data. It is an estimate of the probability distribution of a continuous variable (quantitative variable) and was first introduced by Karl Pearson. ...
The histogram is one of the seven basic tools of quality control." [Histogram. Wikipedia]
The example of diagram templates "Design elements - Histogram" is included in the Seven Basic Tools of Quality solution from the Quality area of ConceptDraw Solution Park.
Histogram templates
This visual dashboard template contains two histograms and two area charts.
Use it to display your frequency distribution data. Each of them is Live Object and shows data from data source files. To select data source file for the chart use Action menu.
The template "Frequency distribution dashboard" for the ConceptDraw PRO diagramming and vector drawing software is included in the Frequency Distribution Dashboard solution from the area "What is a Dashboard" of ConceptDraw Solution Park.
Visual dashboard template

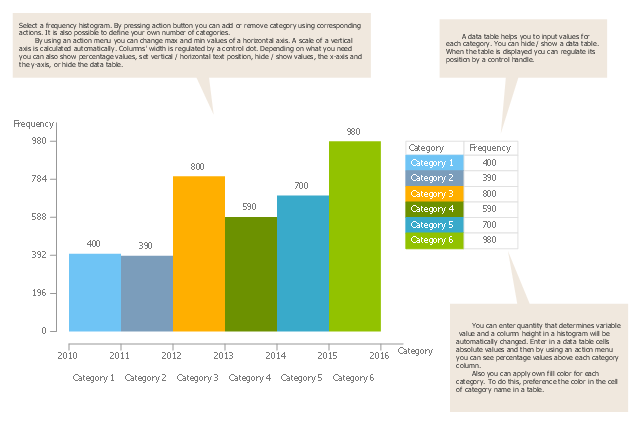
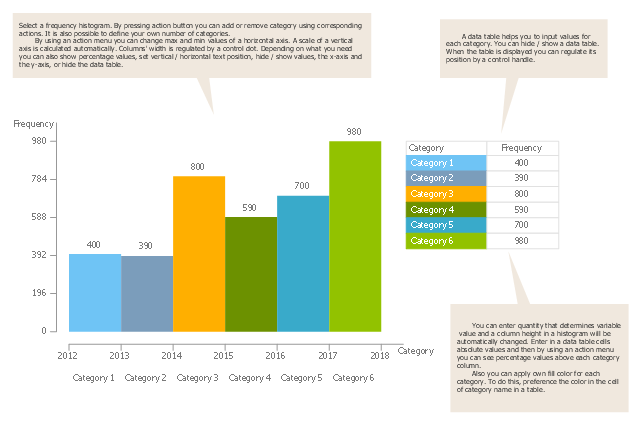
Use this template to design your histograms.
"In probability and statistics, a probability distribution assigns a probability to each measurable subset of the possible outcomes of a random experiment, survey, or procedure of statistical inference. Examples are found in experiments whose sample space is non-numerical, where the distribution would be a categorical distribution; experiments whose sample space is encoded by discrete random variables, where the distribution can be specified by a probability mass function; and experiments with sample spaces encoded by continuous random variables, where the distribution can be specified by a probability density function. More complex experiments, such as those involving stochastic processes defined in continuous time, may demand the use of more general probability measures." [Probability distribution. Wikipedia]
The diagram template "Histogram" for the ConceptDraw PRO diagramming and vector drawing software is included in the Histograms solution from the Graphs and Charts area of ConceptDraw Solution Park.
Template
"In probability and statistics, a probability distribution assigns a probability to each measurable subset of the possible outcomes of a random experiment, survey, or procedure of statistical inference. Examples are found in experiments whose sample space is non-numerical, where the distribution would be a categorical distribution; experiments whose sample space is encoded by discrete random variables, where the distribution can be specified by a probability mass function; and experiments with sample spaces encoded by continuous random variables, where the distribution can be specified by a probability density function. More complex experiments, such as those involving stochastic processes defined in continuous time, may demand the use of more general probability measures." [Probability distribution. Wikipedia]
The histogram template for the ConceptDraw PRO diagramming and vector drawing software is included in the Histograms solution from the Statistical Charts and Diagrams area of ConceptDraw Solution Park.
The histogram template for the ConceptDraw PRO diagramming and vector drawing software is included in the Histograms solution from the Statistical Charts and Diagrams area of ConceptDraw Solution Park.
Histogram template
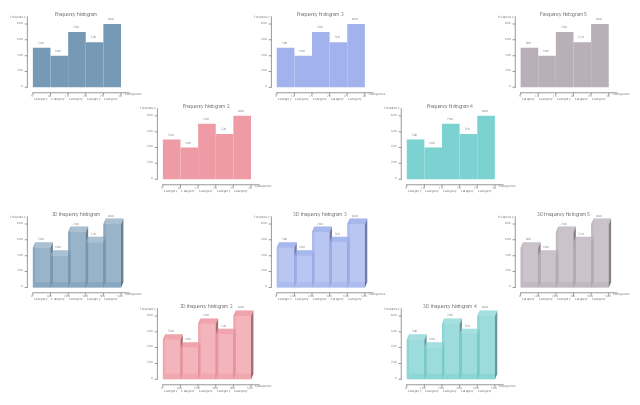
The vector stencils library "Histograms" contains 10 chart templates. Use it to design your histograms for visualizing frequency distribution data in ConceptDraw PRO diagramming and vector drawing software.
"In statistics, a histogram is a graphical representation of the distribution of data. It is an estimate of the probability distribution of a continuous variable...
A histogram is a representation of tabulated frequencies, shown as adjacent rectangles, erected over discrete intervals (bins), with an area equal to the frequency of the observations in the interval. The height of a rectangle is also equal to the frequency density of the interval, i.e., the frequency divided by the width of the interval. The total area of the histogram is equal to the number of data. A histogram may also be normalized displaying relative frequencies. It then shows the proportion of cases that fall into each of several categories, with the total area equaling 1. The categories are usually specified as consecutive, non-overlapping intervals of a variable. The categories (intervals) must be adjacent, and often are chosen to be of the same size. The rectangles of a histogram are drawn so that they touch each other to indicate that the original variable is continuous.
Histograms are used to plot the density of data, and often for density estimation: estimating the probability density function of the underlying variable. The total area of a histogram used for probability density is always normalized to 1." [Histogram. Wikipedia]
The chart templates example "Design elements - Histograms" is included in the Basic Histograms solution from the Graphs and Charts area of ConceptDraw Solution Park.
Chart templates
Use this template to design your histograms.
"In probability and statistics, a probability distribution assigns a probability to each measurable subset of the possible outcomes of a random experiment, survey, or procedure of statistical inference. Examples are found in experiments whose sample space is non-numerical, where the distribution would be a categorical distribution; experiments whose sample space is encoded by discrete random variables, where the distribution can be specified by a probability mass function; and experiments with sample spaces encoded by continuous random variables, where the distribution can be specified by a probability density function. More complex experiments, such as those involving stochastic processes defined in continuous time, may demand the use of more general probability measures." [Probability distribution. Wikipedia]
The diagram template "Histogram" for the ConceptDraw PRO diagramming and vector drawing software is included in the Histograms solution from the Graphs and Charts area of ConceptDraw Solution Park.
"In probability and statistics, a probability distribution assigns a probability to each measurable subset of the possible outcomes of a random experiment, survey, or procedure of statistical inference. Examples are found in experiments whose sample space is non-numerical, where the distribution would be a categorical distribution; experiments whose sample space is encoded by discrete random variables, where the distribution can be specified by a probability mass function; and experiments with sample spaces encoded by continuous random variables, where the distribution can be specified by a probability density function. More complex experiments, such as those involving stochastic processes defined in continuous time, may demand the use of more general probability measures." [Probability distribution. Wikipedia]
The diagram template "Histogram" for the ConceptDraw PRO diagramming and vector drawing software is included in the Histograms solution from the Graphs and Charts area of ConceptDraw Solution Park.
Template
 Basic Histograms
This solution extends the capabilities of ConceptDraw DIAGRAM (or later) with templates, samples and a library of vector stencils for drawing Histograms.
HelpDesk
How to Draw a Histogram

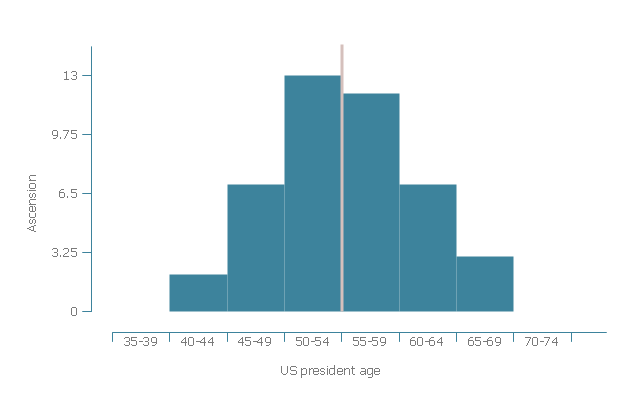
This histogram example was redesigned from the Wikimedia Commons file: Age of presidental ascention.jpg.
"Age of US president at date of ascension to office in five-year age groups."
[commons.wikimedia.org/ wiki/ File:Age_ of_ presidental_ ascention.jpg]
This file is licensed under the Creative Commons Attribution-Share Alike 3.0 Unported license. [creativecommons.org/ licenses/ by-sa/ 3.0/ deed.en]
"Age of presidents when assuming office approximately follows a bell curve (mean age marked by red line, c. 55 years)" [List of Presidents of the United States by age. Wikipedia]
The histogram example "Age of presidential ascension" was created using the ConceptDraw PRO software extended with the Seven Basic Tools of Quality solution from the Quality area of ConceptDraw Solution Park.
Histogram
 Histograms
How to make a Histogram? Making a Histogram is an incredibly easy process when it is done with ConceptDraw DIAGRAM. The Histograms Solution enhances ConceptDraw DIAGRAM functionality with extensive drawing tools, numerous samples, and examples; also a quick-start template and library of ready vector stencils for visualization the data and professional drawing Histograms.
The vector stencils library "Histogram" contains 8 templates of histogram.
Use it to design your histograms with ConceptDraw PRO diagramming and vector drawing software.
"A histogram is a graphical representation of the distribution of numerical data. It is an estimate of the probability distribution of a continuous variable (quantitative variable) and was first introduced by Karl Pearson. ...
The histogram is one of the seven basic tools of quality control." [Histogram. Wikipedia]
The example of diagram templates "Design elements - Histogram" is included in the Seven Basic Tools of Quality solution from the Quality area of ConceptDraw Solution Park.
Use it to design your histograms with ConceptDraw PRO diagramming and vector drawing software.
"A histogram is a graphical representation of the distribution of numerical data. It is an estimate of the probability distribution of a continuous variable (quantitative variable) and was first introduced by Karl Pearson. ...
The histogram is one of the seven basic tools of quality control." [Histogram. Wikipedia]
The example of diagram templates "Design elements - Histogram" is included in the Seven Basic Tools of Quality solution from the Quality area of ConceptDraw Solution Park.
Histogram templates
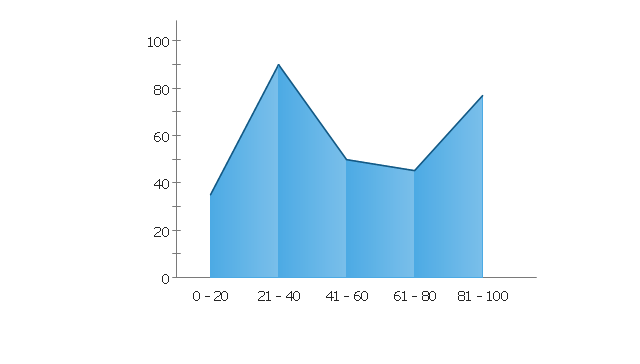
The vector stencils library "Frequency distribution charts" contains 2 area chart templates and 2 histogram templates.
Frequency distribution charts are Live Objects which show the distribution of items within numerical ranges.
Use this library for drawing visual dashboards in the ConceptDraw PRO diagramming and vector drawing software extended with the Frequency Distribution Dashboard solution from the area "What is a Dashboard" of ConceptDraw Solution Park.
Histogram 1

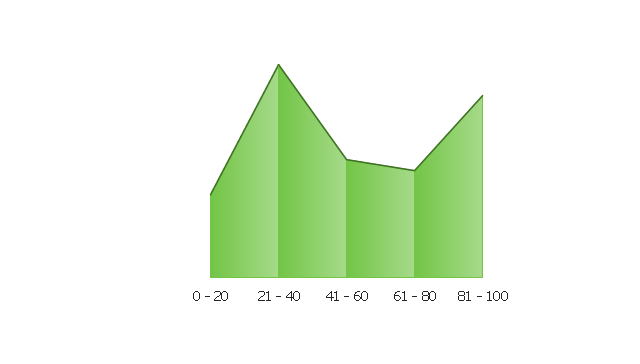
Histogram 2
Area Chart 1
Area Chart 2
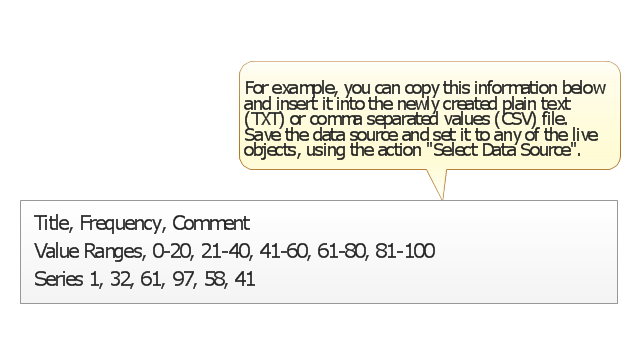
Data Source File Example
Histogram

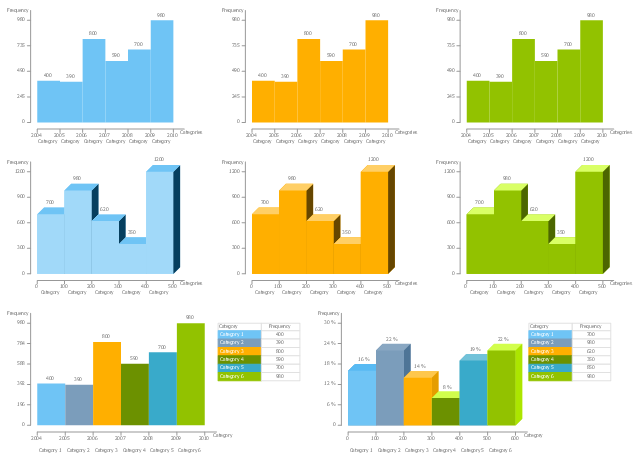
The vector stencils library "Histograms" contains 8 templates of histograms. Use it for visualizing frequency distribution data with ConceptDraw PRO diagramming and vector drawing software.
"In statistics, a histogram is a graphical representation of the distribution of data. It is an estimate of the probability distribution of a continuous variable...
A histogram is a representation of tabulated frequencies, shown as adjacent rectangles, erected over discrete intervals (bins), with an area equal to the frequency of the observations in the interval. The height of a rectangle is also equal to the frequency density of the interval, i.e., the frequency divided by the width of the interval. The total area of the histogram is equal to the number of data. A histogram may also be normalized displaying relative frequencies. It then shows the proportion of cases that fall into each of several categories, with the total area equaling 1. The categories are usually specified as consecutive, non-overlapping intervals of a variable. The categories (intervals) must be adjacent, and often are chosen to be of the same size. The rectangles of a histogram are drawn so that they touch each other to indicate that the original variable is continuous.
Histograms are used to plot the density of data, and often for density estimation: estimating the probability density function of the underlying variable. The total area of a histogram used for probability density is always normalized to 1." [Histogram. Wikipedia]
The diagram templates example "Design elements - Histograms" is included in the Histograms solution from the Graphs and Charts area of ConceptDraw Solution Park.
Templates
 Seven Basic Tools of Quality
Manage quality control in the workplace, using fishbone diagrams, flowcharts, Pareto charts and histograms, provided by the Seven Basic Tools of Quality solution.
Making a Histogram

Seven Basic Tools of Quality - Histogram

How To Make Histogram in ConceptDraw DIAGRAM ?

- Histogram Chart | Seven Basic Tools of Quality - Histogram | How to ...
- Frequency Histogram
- Histograms - Vector stencils library | Frequency distribution charts ...
- Histograms | Histogram Chart | How to Draw a Histogram in ...
- How to Draw a Histogram | Histograms - Vector stencils library ...
- Histogram - Template | Design elements - Histograms | Basic ...
- Page load time - Frequency histogram | Histogram Chart | Make a ...
- Histogram example - Age of presidential ascension | Wind speed ...
- Beetles in the river Thames - Frequency histogram | Preston
- Design elements - Histogram | Histogram | How To Make Histogram ...
- Frequency distribution charts - Vector stencils library | Design ...
- Page load time - Frequency histogram | How to Draw a Histogram in ...
- Histogram Example For Software Development
- Frequency Distribution Dashboard | Frequency distribution ...
- Histograms - Vector stencils library
- Histogram - Template | Normal distribution graph - Template ...
- How to Draw a Histogram in ConceptDraw PRO | Chart Examples ...
- Histogram - Template
- Histograms | Basic Histograms | Histogram | Histograms Solution