 Frequency Distribution Dashboard
Frequency distribution dashboard solution extends ConceptDraw PRO software with samples, templates and vector stencils libraries with histograms and area charts for drawing the visual dashboards showing frequency distribution of data.
This visual dashboard template contains two histograms and two area charts.
Use it to display your frequency distribution data. Each of them is Live Object and shows data from data source files. To select data source file for the chart use Action menu.
The template "Frequency distribution dashboard" for the ConceptDraw PRO diagramming and vector drawing software is included in the Frequency Distribution Dashboard solution from the area "What is a Dashboard" of ConceptDraw Solution Park.
Visual dashboard template

The vector stencils library "Frequency distribution charts" contains 2 area chart templates and 2 histogram templates.
Frequency distribution charts are Live Objects which show the distribution of items within numerical ranges.
Use this library for drawing visual dashboards in the ConceptDraw PRO diagramming and vector drawing software extended with the Frequency Distribution Dashboard solution from the area "What is a Dashboard" of ConceptDraw Solution Park.
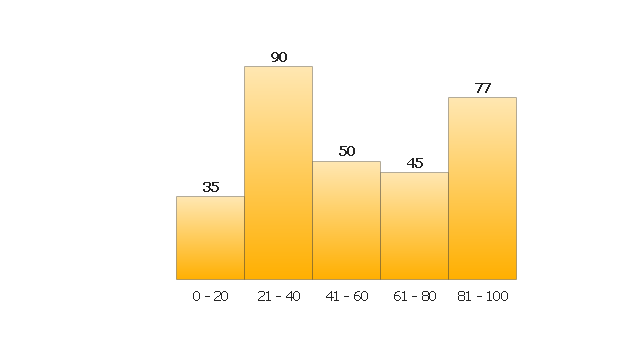
Histogram 1

Histogram 2
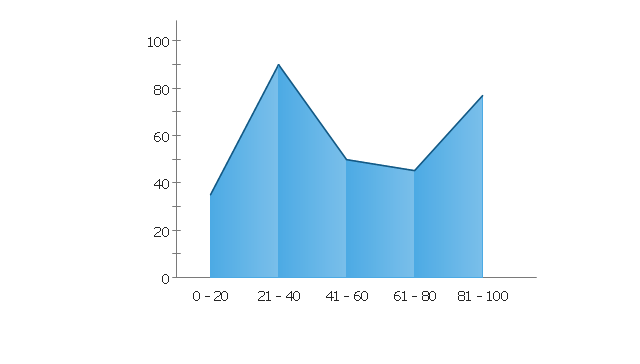
Area Chart 1
Area Chart 2
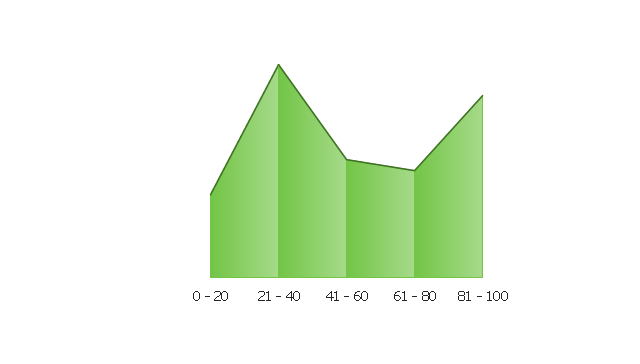
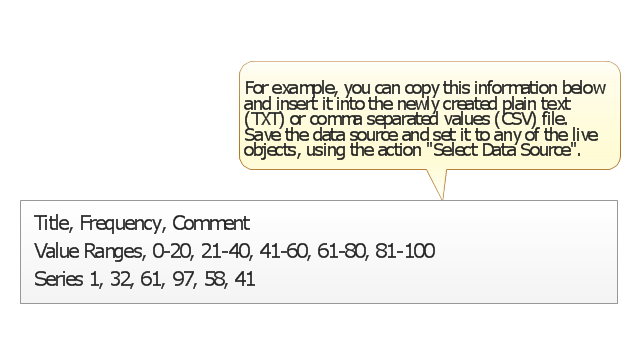
Data Source File Example
 ConceptDraw Solution Park
ConceptDraw Solution Park collects graphic extensions, examples and learning materials
 What is a Dashboard Area
Solutions from the area What is a Dashboard of ConceptDraw Solution Park collects templates, samples and vector stencils libraries with of data driven charts and indicators for drawing the basic types of Visual Dashboards.
 Sales Dashboard
Sales Dashboard solution extends ConceptDraw PRO software with templates, samples and library of vector stencils for drawing the visual dashboards of sale metrics and key performance indicators (KPI).
 Composition Dashboard
Composition dashboard solution extends ConceptDraw PRO software with templates, samples and vector stencils library with charts and indicators for drawing visual dashboards showing data composition.
 Meter Dashboard
Meter dashboard solution extends ConceptDraw PRO software with templates, samples and vector stencils library with meter indicators for drawing visual dashboards showing quantitative data.
 Spatial Dashboard
Spatial dashboard solution extends ConceptDraw PRO software with templates, samples and vector stencils libraries with thematic maps for drawing visual dashboards showing spatial data.
 eLearning for Skype
This solution extends ConceptDraw MINDMAP software with the ability to prepare and run remote learning sessions by using Skype
 Comparison Dashboard
Comparison dashboard solution extends ConceptDraw PRO software with samples, templates and vector stencils library with charts and indicators for drawing the visual dashboard comparing data.
 Correlation Dashboard
Correlation dashboard solution extends ConceptDraw PRO software with samples, templates and vector stencils library with Scatter Plot Charts for drawing the visual dashboard visualizing data correlation.
 Time Series Dashboard
Time series dashboard solution extends ConceptDraw PRO software with templates, samples and vector stencils libraries with charts, graphs and plots for drawing the visual dashboards showing data time series.
 Total Quality Management TQM Diagrams
Total Quality Management Diagrams solution extends ConceptDraw PRO software with samples, templates and vector stencils library for drawing the TQM flowcharts.
 PM Dashboards
This solution extends ConceptDraw PRO and ConceptDraw PROJECT software with the ability to clearly display the identified key performance indicators for any project.
 Status Dashboard
Status dashboard solution extends ConceptDraw PRO software with templates, samples and vector stencils libraries with graphic indicators for drawing the visual dashboards showing status data.
 Histograms
How to make a Histogram? Making a Histogram is an incredibly easy process when it is done with ConceptDraw PRO. The Histograms Solution enhances ConceptDraw PRO v10 functionality with extensive drawing tools, numerous samples, and examples; also a quick-start template and library of ready vector stencils for visualization the data and professional drawing Histograms.
 Event-driven Process Chain Diagrams
Event-driven Process Chain (EPC) Diagram is a type of flowchart widely used for modeling in business engineering and reengineering, business process improvement, and analysis. EPC method was developed within the Architecture of Integrated Information Systems (ARIS) framework.
- Projects HR dashboard | Frequency Distribution Dashboard | Hr ...
- Frequency Distribution Dashboard | Design elements - Meter ...
- Sales Dashboards for Your Company | Frequency Distribution ...
- Sales Dashboard - Access Anywhere | Frequency Distribution ...
- Employee dashboard | Frequency Distribution Dashboard | HR ...
- Flowcharts | Frequency Distribution Dashboard | Flowchart Hr Images
- Histograms | Frequency Distribution Dashboard | Pyramid Chart ...
- HR dashboard | Projects HR dashboard | Frequency Distribution ...
- Spatial Dashboard | Composition Dashboard | Frequency ...
- ConceptDraw Solution Park | Frequency Distribution Dashboard ...
- Frequency Distribution Dashboard | Hr Metrics Examples
- Frequency Distribution Dashboard | Interior Design Storage and ...
- Frequency Distribution Dashboard | Time Series Dashboard ...
- Frequency Distribution Dashboard | Hr Dash
- Frequency Distribution Dashboard | Event-driven Process Chain ...
- Frequency distribution dashboard - Template
- Design elements - Comparison charts and indicators | Design ...
- Flowchart - HR management process | HR dashboard | Projects HR ...
- Design elements - Histograms | Histogram template | Design ...
- Design elements - Comparison charts and indicators | What is a ...