HelpDesk
How to Connect a Live Object to a CSV Data Source

HelpDesk
How to Create a Time Series Dashboard

HelpDesk
How to Create a Meter Dashboard

HelpDesk
How to Make a Logistic Dashboard

HelpDesk
How to Make Business Intelligence Dashboard

HelpDesk
How To Create an HR Metric Dashboard

HelpDesk
How to Create a Sales Dashboard

The vector stencils library Comparison charts contains 4 Live Objects: Horizontal bar chart, Column chart (Vertical bar chart), Line chart and Dot plot (Scatter chart).
The vector stencils library Comparison indicators contains 7 Live Objects:
Two column indicator, Two bubbles indicator, Scales indicator, Left and right arrows indicator, Up and down arrows indicator, Two up arrows indicator.
The ConceptDraw Live Objects are ready-to-use templates of charts and visual indicators for dashboard design. You can set data source file for Each Live Object, and your charts or indicators will represents actual data from the data source files, and change their appearance with changing of the data in source files. The comparison charts and indicators are useful to compare and rank of your data by categories.
Use the design elements libraries "Comparison charts" and "Comparison indicators" to create your own business visual dashboards using the ConceptDraw PRO diagramming and vector drawing software.
The example "Design elements - Comparison charts and indicators" is included in the Comparison Dashboard solution from the area "What is a Dashboard" of ConceptDraw Solution Park.
Data comparison charts and visual indicators

HelpDesk
How To Create a CRM System Dashboard

Sales Dashboard

HelpDesk
How to Contribute Drawing With Library Objects

HelpDesk
How to Use ConceptDraw Dashboard for Facebook on PC

Comparing ConceptDraw DIAGRAM to Omnigraffle

 Correlation Dashboard
Correlation dashboard solution extends ConceptDraw DIAGRAM software with samples, templates and vector stencils library with Scatter Plot Charts for drawing the visual dashboard visualizing data correlation.
Scrum workflow

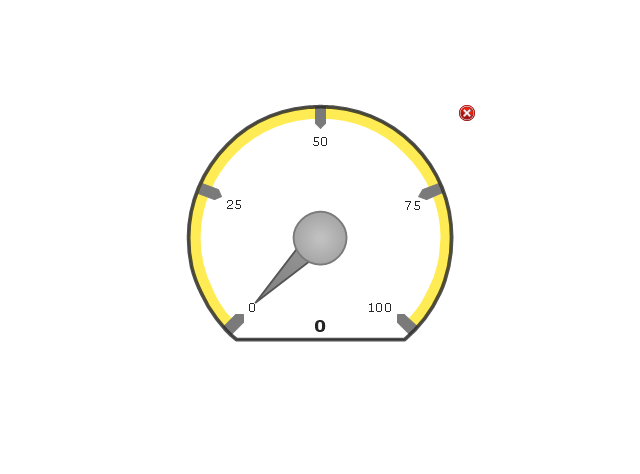
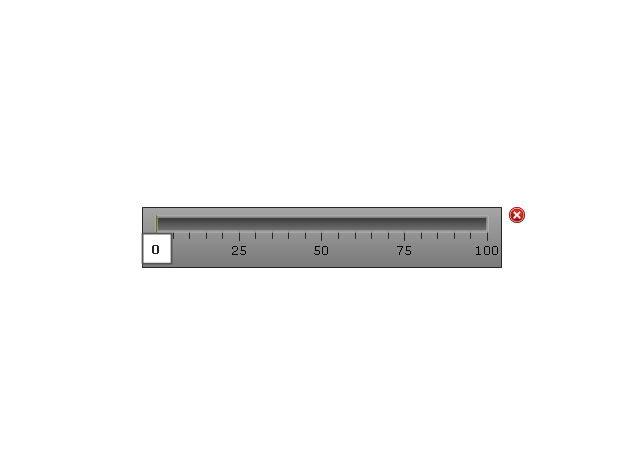
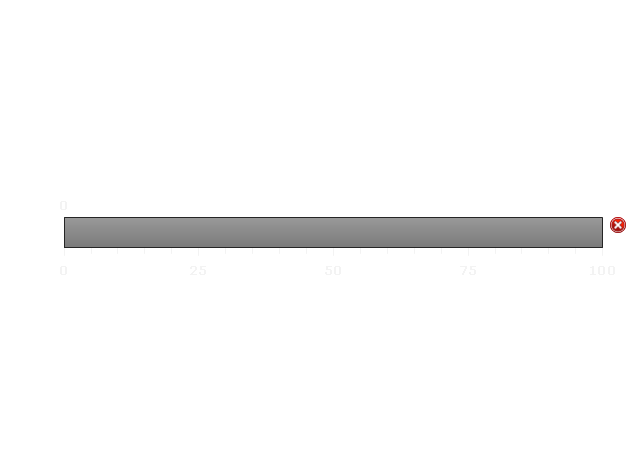
The vector stencils library "Meter indicators" contains 29 Live Objects: speedometer gauge, dial, bullet graph, slider and level meter visual indicators.
The Live Objects designed to display actual measures of performance metrics and KPIs from external data source files.
Some of them also display comparative measures, and colored zones of qualitative ranges with legend.
Use it to draw business performance dashboards using the ConceptDraw PRO diagramming and vector drawing software .
"Digital dashboards may be laid out to track the flows inherent in the business processes that they monitor. Graphically, users may see the high-level processes and then drill down into low level data. This level of detail is often buried deep within the corporate enterprise and otherwise unavailable to the senior executives. ...
Specialized dashboards may track all corporate functions. Examples include human resources, recruiting, sales, operations, security, information technology, project management, customer relationship management and many more departmental dashboards. ...
Like a car's dashboard (or control panel), a software dashboard provides decision makers with the input necessary to "drive" the business. Thus, a graphical user interface may be designed to display summaries, graphics (e.g., bar charts, pie charts, bullet graphs, "sparklines," etc.), and gauges (with colors similar to traffic lights) in a portal-like framework to highlight important information. ...
Digital dashboards allow managers to monitor the contribution of the various departments in their organization. To gauge exactly how well an organization is performing overall, digital dashboards allow you to capture and report specific data points from each department within the organization, thus providing a "snapshot" of performance." [Dashboard (management information systems). Wikipedia]
The example "Design elements - Meter indicators" is included in the Meter Dashboard solution from the area "What is a Dashboard" of ConceptDraw Solution Park.
Visual indicators

 Logistic Dashboard
The powerful tools of Logistic Dashboard solution and specially developed live graphic objects of logistic icons, logistic navigation elements, logistic indicators, logistic charts and logistic maps effectively assist in designing Logistic dashboards, Logistic maps, Logistic charts, diagrams and infographics. The included set of prebuilt samples and quick-start templates, demonstrates the power of ConceptDraw DIAGRAM software in logistics management, its assisting abilities in development, realization and analyzing the logistic processes, as well as in perfection the methods of logistics management.
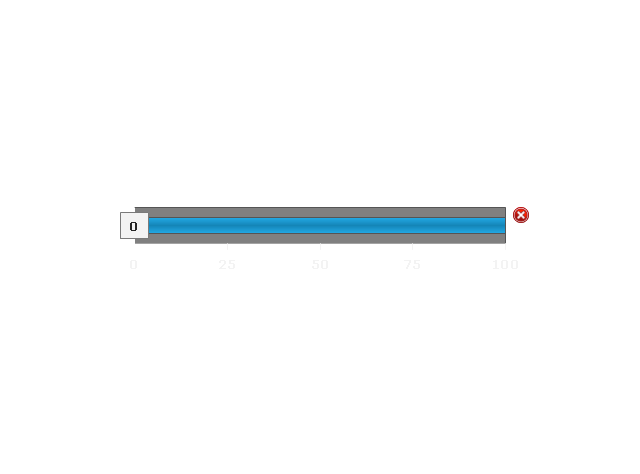
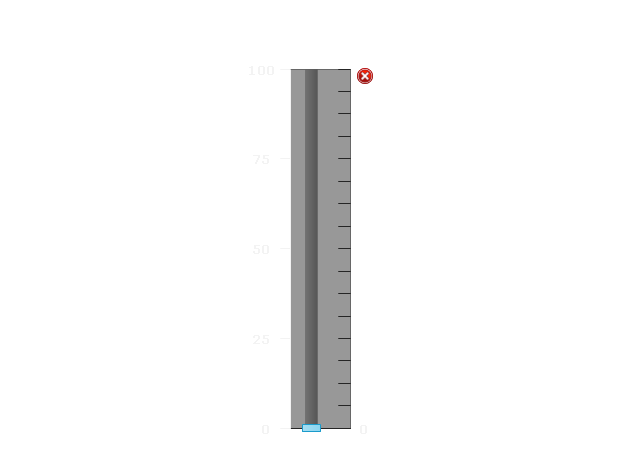
The vector stencils library "Meter indicators 2" (for dark background) contains 29 Live Objects: speedometer gauge, dial, bullet, slider and level meter visual indicators.
The Live Objects designed to display actual measures of performance metrics from external data source files. Some of them also display comparative measures, and colored zones of qualitative ranges with legend.
Use this library to create visual dashboards in the ConceptDraw PRO diagramming and vector drawing software extended with the Meter Dashboard solution from the area "What is a Dashboard" of ConceptDraw Solution Park.
Speedometer Gauge 1

Speedometer Gauge 2
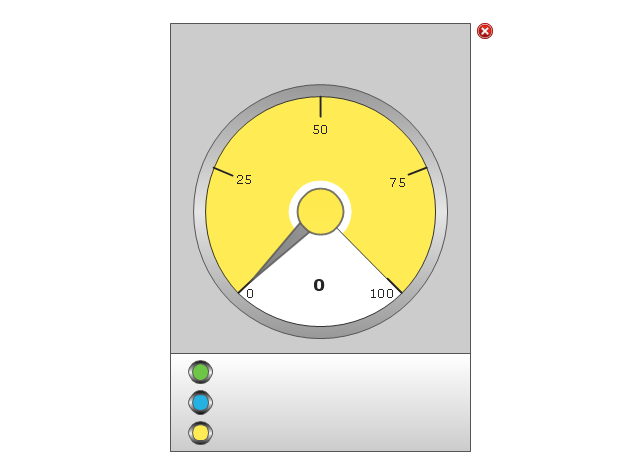
Speedometer Gauge 3
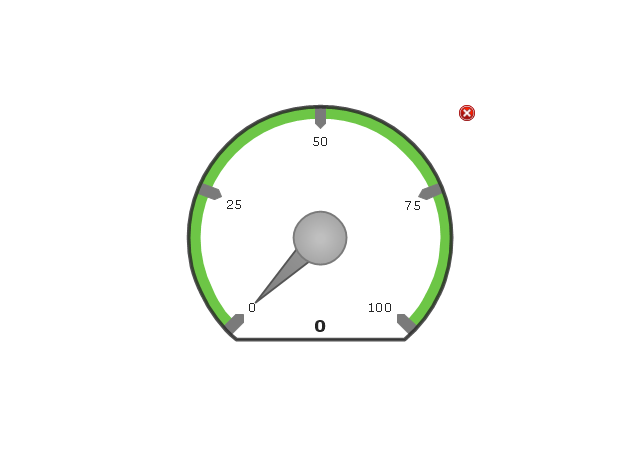
Speedometer Gauge 4
Dial 1
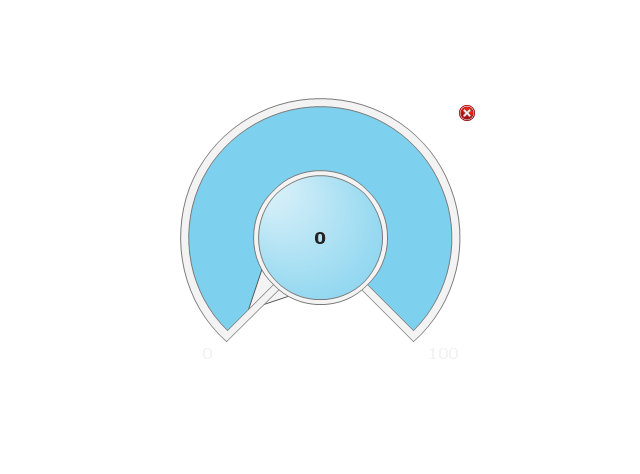
Dial 2
Bullet 1

Bullet 2
Bullet 3
Bullet 4

Bullet 5

Bullet 6

Directed Bullet 1
Directed Bullet 2

Slider Horizontal 1
Slider Horizontal 2
Slider Horizontal 3
Slider Horizontal 4
Slider Vertical 1
Slider Vertical 2
Slider Horizontal 5
Slider Horizontal 6
Slider Horizontal 7
Slider Vertical 3
Level Meter 1
Level Meter 2
Level Meter 3
Level Meter 4
Level Meter 5
 CRM Center Dashboard
The CRM Center Dashboard solution extends ConceptDraw DIAGRAM functionality with CRM software tools, large collection of CRM Charts live objects, CRM icons, CRM indicators, CRM maps and navigation elements, the set of professionally designed CRM samples and templates to help you construct your own CRM Dashboards and CRM Center Dashboards in a few minutes, to depict the current and actual data by connecting or refreshing the data source file. The customer management software ConceptDraw DIAGRAM makes you free to choose the style for your dashboard and to regulate the quantity of clipart on the diagram according to your taste.
- How to Connect a Live Object to a CSV Data Source | How to Create ...
- KPI Dashboard | Sales Dashboard | How to Connect a Live Object to ...
- How to Connect a Live Object to a Text Data Source | How to ...
- How to Connect Text Data to a Time Series Chart on Your Live ...
- How to Use ConceptDraw Sales Dashboard Solution | PM ...
- How to Connect a Live Object to a CSV Data Source | Basic ...
- ConceptDraw Office Case Study
- Comparison indicators - Vector stencils library | Design elements ...
- How to Connect a Live Object to a Text Data Source | Open Source ...
- Comparison Dashboard | Design elements - Comparison charts and ...
- Design elements - Comparison charts and indicators | Design ...
- Feature Comparison Chart Software | Financial Comparison Chart ...
- Dot Plot
- Time Series Dashboard
- ConceptDraw DIAGRAM Compatibility with MS Visio | Visio Files ...
- How to Connect a Live Object to a CSV Data Source | Flowchart ...
- Meter indicators 2 - Vector stencils library | Design elements - Meter ...
- Balanced Scorecard Software | ConceptDraw Solution Park | Design ...
- Design elements - Comparison charts and indicators | Comparison ...