HelpDesk
How to Connect a Live Object to a CSV Data Source

HelpDesk
How to Create a Meter Dashboard

ConceptDraw DIAGRAM - Organizational chart software

HelpDesk
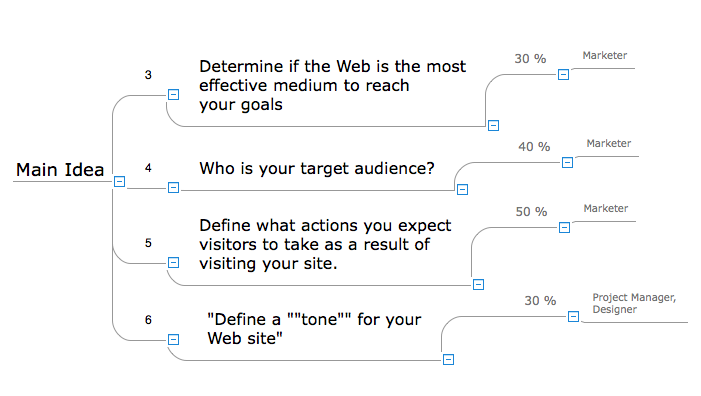
How to Input Data from MS Excel Into a Mind Map
Organizational Chart Template

 Meter Dashboard
Meter dashboard solution extends ConceptDraw DIAGRAM software with templates, samples and vector stencils library with meter indicators for drawing visual dashboards showing quantitative data.
 ConceptDraw Dashboard for Facebook
ConceptDraw Dashboard for Facebook solution extends ConceptDraw DIAGRAM software with a dynamically updated visual dashboard, which shows lifetime total likes, daily friends of fans, and daily page views, information you can receive from Facebook Insights.
 Status Dashboard
Status dashboard solution extends ConceptDraw DIAGRAM software with templates, samples and vector stencils libraries with graphic indicators for drawing the visual dashboards showing status data.
 Spatial Dashboard
Spatial dashboard solution extends ConceptDraw DIAGRAM software with templates, samples and vector stencils libraries with thematic maps for drawing visual dashboards showing spatial data.
- The Best Drawing Program for Mac | How to Connect Tabular Data ...
- The Facts and KPIs | How to Connect Tabular Data ( CSV ) to a ...
- Performance Indicators | How to Connect Tabular Data ( CSV ) to a ...
- How to Connect Tabular Data ( CSV ) to a Graphic Indicator on Your ...
- Data Visualization Solutions | How to Connect Tabular Data ( CSV ...
- Mechanical Drawing Symbols | How to Connect Tabular Data ( CSV ...
- Percentage Pie Chart. Pie Chart Examples | How to Connect ...
- Basic Flowchart Symbols and Meaning | How to Connect Tabular ...
- Electrical Symbols, Electrical Diagram Symbols | How to Connect ...
- Performance Indicators | What is a KPI? | How to Connect Tabular ...
- How to Connect a Live Object to a Text Data Source | How to ...
- ConceptDraw | Press Releases
- Logistic Dashboard | Sales Dashboard | PM Dashboards ...
- Performance Indicators | Design elements - Sales dashboard | Sales ...
- PERT Chart Software | Program Evaluation and Review Technique ...
- KPI Dashboard | Sales Dashboard | How to Connect a Live Object to ...
- How to Create a Sales Dashboard Using ConceptDraw PRO ...
- Matrix Organization Structure | Create Organizational Chart | How to ...
- How to Input Data from MS Excel Into a Mind Map | How to Import ...