Balanced Scorecard Software
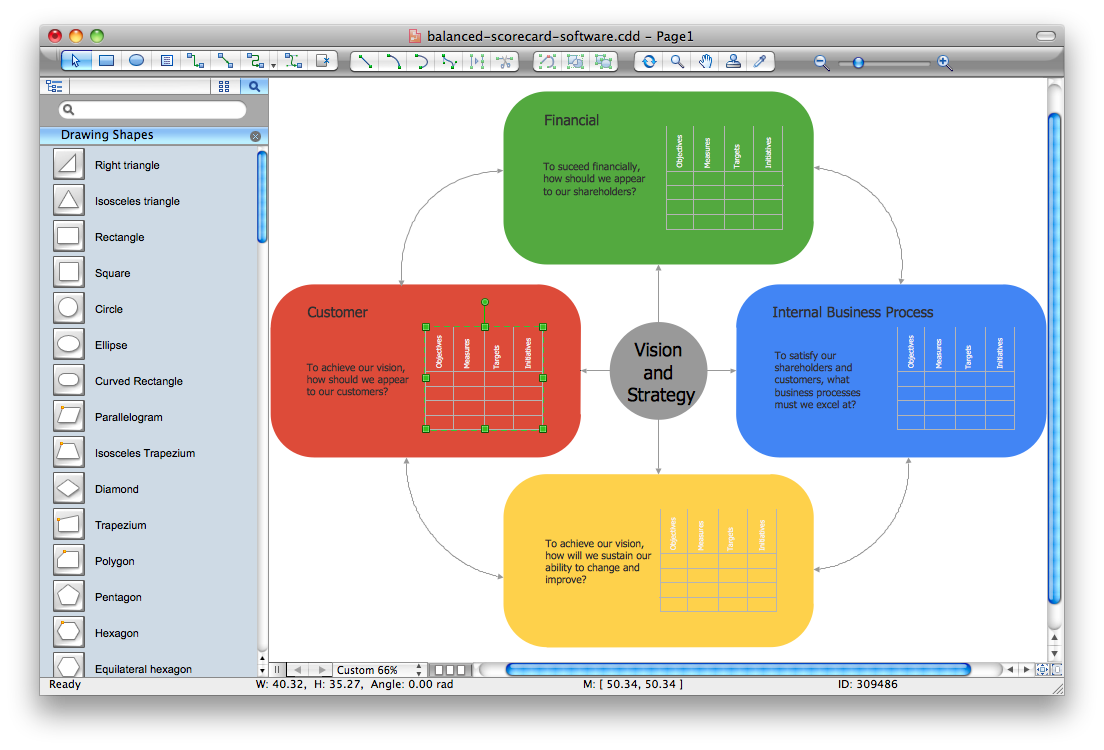
Balanced Scorecard Software provide incredible large variety of samples, templates and libraries of predesigned vector objects. Nothing could be easy that use the predesigned template and fill it, and simply drag the ready-to-use objects for designing your own balanced scorecard diagram.
 ConceptDraw Solution Park
ConceptDraw Solution Park collects graphic extensions, examples and learning materials
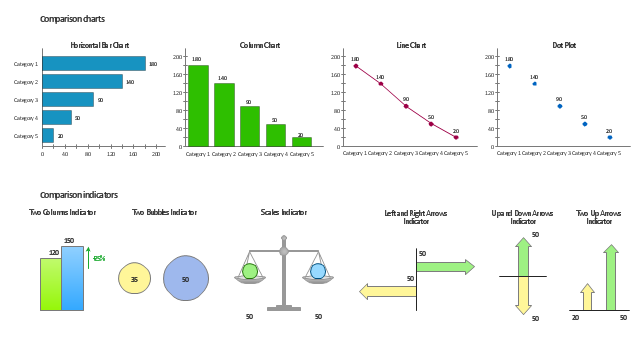
The vector stencils library Comparison charts contains 4 Live Objects: Horizontal bar chart, Column chart (Vertical bar chart), Line chart and Dot plot (Scatter chart).
The vector stencils library Comparison indicators contains 7 Live Objects:
Two column indicator, Two bubbles indicator, Scales indicator, Left and right arrows indicator, Up and down arrows indicator, Two up arrows indicator.
The ConceptDraw Live Objects are ready-to-use templates of charts and visual indicators for dashboard design. You can set data source file for Each Live Object, and your charts or indicators will represents actual data from the data source files, and change their appearance with changing of the data in source files. The comparison charts and indicators are useful to compare and rank of your data by categories.
Use the design elements libraries "Comparison charts" and "Comparison indicators" to create your own business visual dashboards using the ConceptDraw PRO diagramming and vector drawing software.
The example "Design elements - Comparison charts and indicators" is included in the Comparison Dashboard solution from the area "What is a Dashboard" of ConceptDraw Solution Park.
 Business Process Diagrams
The Business Process Diagram Solution extends ConceptDraw PRO v10 BPMN software with its RapidDraw interface, templates, samples, and libraries based on the BPMN 1.2 and BPMN 2.0 standards. This powerful solution permits you to visualize easily both simple and complex processes, as well as design business models. The Business Process Diagram solution allows one to quickly develop and document in detail any business processes at any stage of a project’s planning and implementation.
 Computer and Networks Area
The solutions from Computer and Networks Area of ConceptDraw Solution Park collect samples, templates and vector stencils libraries for drawing computer and network diagrams, schemes and technical drawings.
 Telecommunication Network Diagrams
Telecommunication Network Diagrams solution extends ConceptDraw PRO software with samples, templates and libraries of vector stencils for drawing the diagrams of telecommunication networks.
 Food Court
Use the Food Court solution to create food art. Pictures of food can be designed using libraries of food images, fruit art and pictures of vegetables.
 Value Stream Mapping
Value stream mapping solution extends ConceptDraw PRO software with templates, samples and vector stencils for drawing the Value Stream Maps (VSM) in lean manufacturing practice.
 Fire and Emergency Plans
This solution extends ConceptDraw software with samples, templates and design elements for drawing the Fire and Emergency Plans.
 School and Training Plans
Planning a school and its campus layout needs to depict the premises, represent internal spaces, location of windows and direction of natural light. Detailed classroom seating chart helps you visualize location of the blackboard and desks, taking into account the specifics of the room and its lighting, with a goal to design the classroom to be comfortable for each pupil and teacher.
 Mechanical Engineering
This solution extends ConceptDraw PRO v.9 mechanical drawing software (or later) with samples of mechanical drawing symbols, templates and libraries of design elements, for help when drafting mechanical engineering drawings, or parts, assembly, pneumatic,
 Network Layout Floor Plans
Network Layout Floor Plan solution extends ConceptDraw PR software with samples, templates and libraries of vector stencils for drawing the computer network layout floor plans.
 Cross-Functional Flowcharts
Cross-functional flowcharts are powerful and useful tool for visualizing and analyzing complex business processes which requires involvement of multiple people, teams or even departments. They let clearly represent a sequence of the process steps, the order of operations, relationships between processes and responsible functional units (such as departments or positions).
 Entity-Relationship Diagram (ERD)
An Entity-Relationship Diagram (ERD) is a visual presentation of entities and relationships. That type of diagrams is often used in the semi-structured or unstructured data in databases and information systems. At first glance ERD is similar to a flowch
- Excel Floor Plan Template
- How To Create A Floor Plan In Excel
- Time Series Dashboard | Time series charts - Vector stencils library ...
- Customer Relationship Management | Dashboard | Balanced ...
- Sales Dashboard | Sales Dashboard | How to Create a Timeline ...
- How to Connect a Live Object to a CSV Data Source | How to ...
- Free Dashboard Templates Powerpoint
- Design Dashboard
- Interior Design Storage and Distribution - Design Elements ...
- Performance Indicators | What is a KPI? | KPIs and Metrics ...
- What is a Dashboard Area | Business Intelligence Dashboard ...
- Comparison Dashboard | Design elements - Comparison charts and ...
- Comparison Dashboard | Feature Comparison Chart Software ...
- How to Input Data from MS Excel Into a Mind Map | How to Import ...
- Comparison indicators - Vector stencils library | Design elements ...
- Excel Org Chart Templates
- How to Export Project Data to MS Excel Worksheet | How to Import ...
- Design elements - Time series charts | Line Chart Examples | Chart ...
- Financial Comparison Chart | Column Chart Software | Design ...
- How to Input Data from MS Excel Into a Mind Map | Process ...

