Feature Comparison Chart Software

Financial Comparison Chart

Organigrams with ConceptDraw DIAGRAM

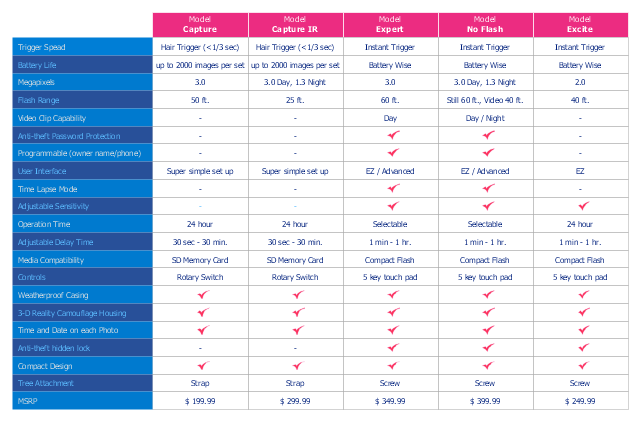
Competitive Feature Comparison Matrix is a tool to compare the features and functionality of competitive products or services in side-by-side table.
The feature comparison matrices are used for feature comparison analysis of competitive products and services.
This competitive feature comparison matrix chart example was created using the ConceptDraw PRO diagramming and vector drawing software extended with the Matrices solution from the Marketing area of ConceptDraw Solution Park.
Feature comparison chart
Column Chart Software

Swot Analysis Examples for Mac OSX

How To create Value Stream Map (VSM)
 *")
Relative Value Chart Software

TQM Diagram Example

Bar Chart

Relative Circular Diagram

Comparison List

Growth-Share Matrix Software

Bar Chart Software

Root Cause Tree Diagram

Probability Quality Control Tools

Decision Making Software For Small Business


Tools to Create Your Own Infographics

SWOT analysis Software & Template for Macintosh and Windows

Agile Methodology

- Feature Comparison Chart Software | SWOT Analysis matrix ...
- Feature Comparison Chart Software | Deployment Chart Software ...
- Feature Comparison Chart Software | Financial Comparison Chart ...
- Feature Comparison Chart Software | Marketing | Competitor ...
- Feature Comparison Chart Software | Comparing ConceptDraw ...
- Financial Comparison Chart | Feature Comparison Chart Software ...
- Feature Comparison Chart Software | Chart Software for Better ...
- Process Flowchart | Feature Comparison Chart Software
- Comparing ConceptDraw PRO to Omnigraffle | Feature Comparison ...
- Feature Comparison Chart Software | SWOT Analysis Tool for Small ...