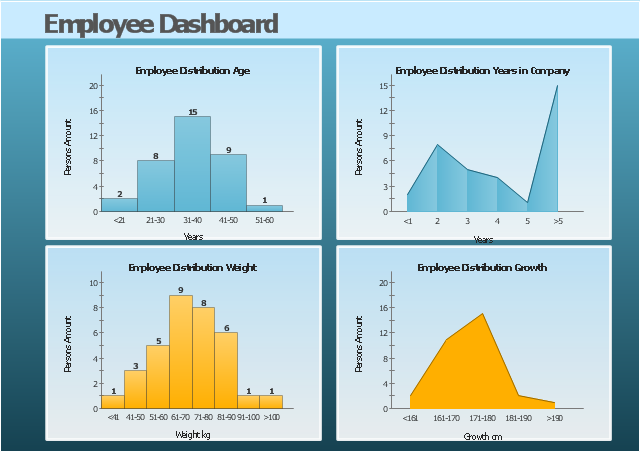
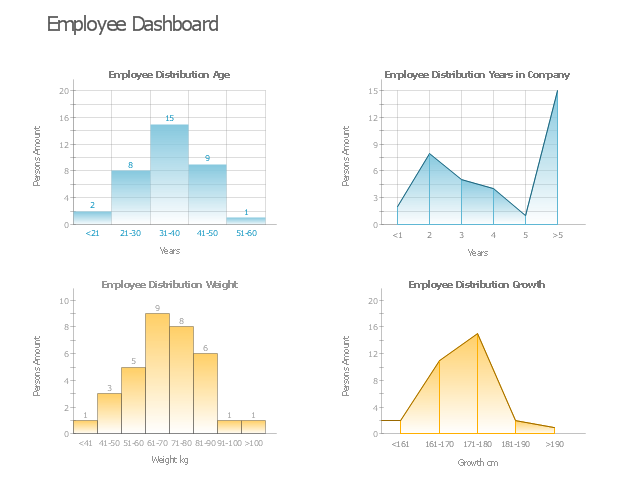
This HR dashboard example include histograms "Employee Distribution by Age" and "Employee Distribution by Weight", and area charts "Employee Distribution by Years in Company" and "Employee Distribution by Growth".
"Human resource management (HRM, or simply HR) is the management process of an organization's workforce, or human resources. It is responsible for the attraction, selection, training, assessment, and rewarding of employees, while also overseeing organizational leadership and culture and ensuring compliance with employment and labor laws. In circumstances where employees desire and are legally authorized to hold a collective bargaining agreement, HR will also serve as the company's primary liaison with the employees' representatives (usually a trades union)." [Human resource management. Wikipedia]
The example "Employee dashboard" was created using the ConceptDraw PRO diagramming and vector drawing software extended with the Frequency Distribution Dashboard solution from the area "What is a Dashboard" of ConceptDraw Solution Park.
Visual dashboard
This projects HR dashboard example includes the histogram of employees distribution by salary, the area chart of salari distribution, and two horizontal bar charts: "Employees by Project Teams" and "Payroll Breakdown".
"Project Portfolio Management (PPM) is the centralized management of processes, methods, and technologies used by project managers and project management offices (PMOs) to analyze and collectively manage a group of current or proposed projects based on numerous key characteristics. The objectives of PPM are to determine the optimal resource mix for delivery and to schedule activities to best achieve an organization’s operational and financial goals ― while honouring constraints imposed by customers, strategic objectives, or external real-world factors. ... With PPM, the Office of Finance can improve their accuracy for estimating and managing the financial resources of a project or group of projects. In addition, the value of projects can be demonstrated in relation to the strategic objectives and priorities of the organization through financial controls and to assess progress through earned value and other project financial techniques." [Project portfolio management. Wikipedia]
The example "Projects HR dashboard" was created using the ConceptDraw PRO diagramming and vector drawing software extended with the Frequency Distribution Dashboard solution from the area "What is a Dashboard" of ConceptDraw Solution Park.
Visual dashboard

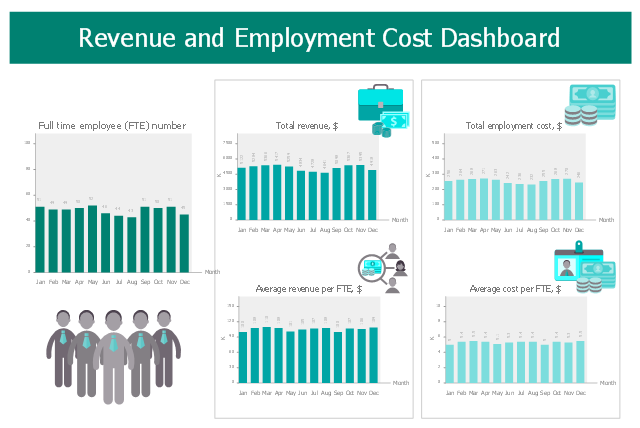
This HR dashboard sample visualizes KPIs: full time employee (FTE) number, total revenue, average revenue per FTE, total employment cost, average cost per FTE.
"Employment is a relationship between two parties, usually based on a contract where work is paid for, where one party, which may be a corporation, for profit, not-for-profit organization, co-operative or other entity is the employer and the other is the employee. Employees work in return for payment, which may be in the form of an hourly wage, by piecework or an annual salary, depending on the type of work an employee does or which sector she or he is working in. Employees in some fields or sectors may receive gratuities, bonus payment or stock options. In some types of employment, employees may receive benefits in addition to payment. Benefits can include health insurance, housing, disability insurance or use of a gym." [Employment. Wikipedia]
The human resources dashboard example "Revenue and Employment Cost Dashboard" was designed using ConceptDraw PRO software extended with HR Dashboard solution from Management area of ConceptDraw Solution Park.
HR dashboard
This example was created on the base of the Georgia DOT Performance Management Dashboard from the Georgia Department of Transportation website.
[dot.ga.gov/ informationcenter/ statistics/ performance/ Pages/ default.aspx]
"Performance management (PM) includes activities which ensure that goals are consistently being met in an effective and efficient manner. Performance management can focus on the performance of an organization, a department, employee, or even the processes to build a product of service, as well as many other areas.
PM is also known as a process by which organizations align their resources, systems and employees to strategic objectives and priorities.
Performance management originated as a broad term coined by Dr. Aubrey Daniels in the late 1970s to describe a technology (i.e. science imbedded in applications methods) for managing both behavior and results, two critical elements of what is known as performance. A formal definition of performance management, according to Daniels' is "a scientifically based, data-oriented management system. It consists of three primary elements-measurement, feedback and positive reinforcement."" [Performance management. Wikipedia]
The meter dashboard example "Georgia DOT Performance Management" was created using the ConceptDraw PRO diagramming and vector drawing software extended with the Meter Dashboard solution from the area "What is a Dashboard" of ConceptDraw Solution Park.
Meter dashboard

This HR dashboard example include histograms "Employee Distribution by Age" and "Employee Distribution by Weight", and area charts "Employee Distribution by Years in Company" and "Employee Distribution by Growth".
"Human resources is the set of individuals who make up the workforce of an organization, business sector, or economy. "Human capital" is sometimes used synonymously with human resources, although human capital typically refers to a more narrow view (i.e., the knowledge the individuals embody and can contribute to an organization). Likewise, other terms sometimes used include "manpower", "talent", "labour", or simply "people". The professional discipline and business function that oversees an organization's human resources is called human resource management (HRM, or simply HR)." [Human resources. Wikipedia]
The example "HR dashboard" was created using the ConceptDraw PRO diagramming and vector drawing software extended with the Frequency Distribution Dashboard solution from the area "What is a Dashboard" of ConceptDraw Solution Park.
Visual dashboard
 Frequency Distribution Dashboard
Frequency distribution dashboard solution extends ConceptDraw DIAGRAM software with samples, templates and vector stencils libraries with histograms and area charts for drawing the visual dashboards showing frequency distribution of data.
 HR Dashboard
The HR Dashboard solution extends ConceptDraw DIAGRAM functionality with powerful drawing tools and great collection of comprehensive vector design elements, icons, pictograms and objects, navigation elements, live objects of HR charts, HR indicators, and thematic maps. The range of HR Dashboards applications is extensive, among them the human resource management, recruitment, hiring process, human resource development. ConceptDraw DIAGRAM software is perfect for creation HR Dashboard with any goal you need. It gives you all opportunities for designing not only informative, but also professional looking and attractive HR Dashboards of any style and degree of detalization, that are perfect for using in presentations, reports and other thematic documents.
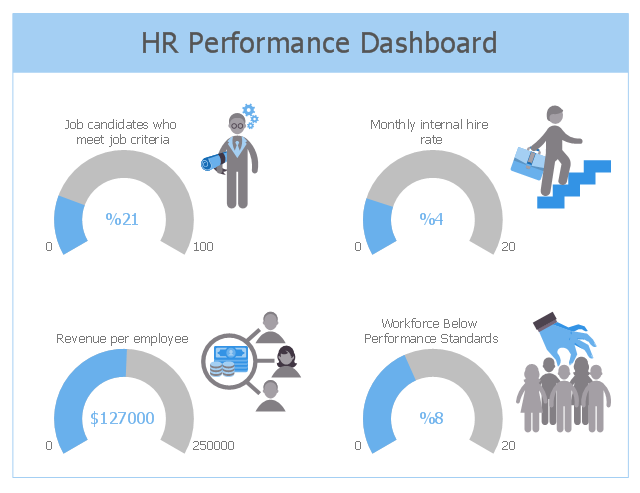
This HR dashboard sample depicts KPIs: job candidates who meet job criteria, monthly internal hire rate, revenue per employee, workforce below performance standards.
"Dashboards often provide at-a-glance views of KPIs (key performance indicators) relevant to a particular objective or business process (e.g. sales, marketing, human resources, or production).
... a human resources dashboard may show numbers related to staff recruitment, retention and composition, for example number of open positions, or average days or cost per recruitment." [Dashboard (business). Wikipedia]
The human resources dashboard example "HR Performance Dashboard" was designed using ConceptDraw PRO software extended with HR Dashboard solution from Management area of ConceptDraw Solution Park.
KPIs dashboard
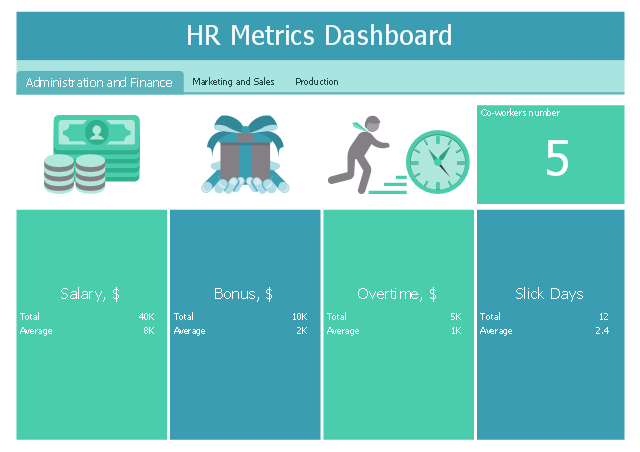
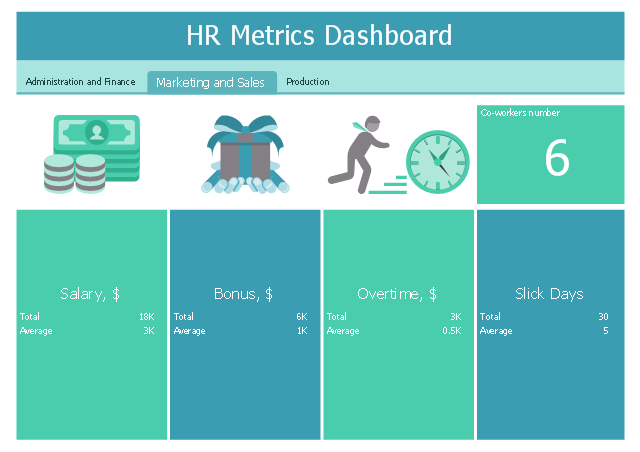
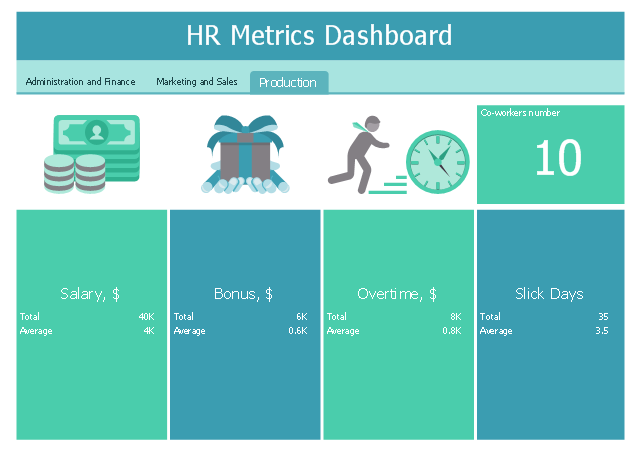
This performance dashboard sample shows HR metrics by departments: co-workrers number, salary, bonus, overtime, slick days.
"Human Resource (HR) metrics are measurements used to determine the value and effectiveness of HR initiatives, typically including such areas as turnover, training, return on human capital, costs of labor, and expenses per employee." [HR Metric. Wikipedia]
The human resources dashboard example "HR Metrics Dashboard" was designed using ConceptDraw PRO software extended with HR Dashboard solution from Management area of ConceptDraw Solution Park.
Administration and Finance
Marketing and Sales
Production
This financila dashboard example was drawn on the base of the Enterprise dashboard from the Mecklenburg County Government website.
[charmeck.org/ mecklenburg/ county/ CountyManagersOffice/ OMB/ dashboards/ Pages/ Enterprise.aspx]
"In management information systems, a dashboard is "an easy to read, often single page, real-time user interface, showing a graphical presentation of the current status (snapshot) and historical trends of an organization’s key performance indicators to enable instantaneous and informed decisions to be made at a glance."
For example, a manufacturing dashboard may show key performance indicators related to productivity such as number of parts manufactured, or number of failed quality inspections per hour. Similarly, a human resources dashboard may show KPIs related to staff recruitment, retention and composition, for example number of open positions, or average days or cost per recruitment.
Types of dashboards.
Dashboard of Sustainability screen shot illustrating example dashboard layout.
Digital dashboards may be laid out to track the flows inherent in the business processes that they monitor. Graphically, users may see the high-level processes and then drill down into low level data. This level of detail is often buried deep within the corporate enterprise and otherwise unavailable to the senior executives.
Three main types of digital dashboard dominate the market today: stand alone software applications, web-browser based applications, and desktop applications also known as desktop widgets. The last are driven by a widget engine.
Specialized dashboards may track all corporate functions. Examples include human resources, recruiting, sales, operations, security, information technology, project management, customer relationship management and many more departmental dashboards.
Digital dashboard projects involve business units as the driver and the information technology department as the enabler. The success of digital dashboard projects often depends on the metrics that were chosen for monitoring. Key performance indicators, balanced scorecards, and sales performance figures are some of the content appropriate on business dashboards." [Dashboard (management information systems). Wikipedia]
The example "Enterprise dashboard" was created using the ConceptDraw PRO diagramming and vector drawing software extended with the Composition Dashboard solution from the area "What is a Dashboard" of ConceptDraw Solution Park.
Financial dashboard

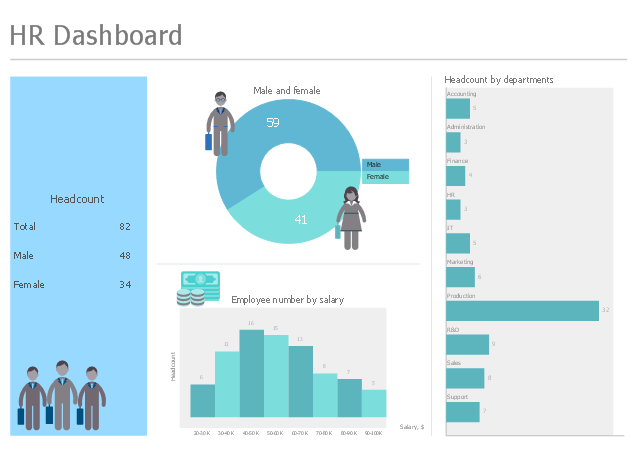
This HR dashboard sample shows business metrics and KPIs for human resources management: headcount, male and female ratio, employee distribution by salary, headcount by departments.
"Human Resource Management (HRM or HR) is the management of human resources. It is designed by the HR Department to maximize employee performance in service of an employer's strategic objectives. HR is primarily concerned with the management of people within organizations, focusing on policies and on systems. HR departments are responsible for overseeing employee-benefits design, employee recruitment, training and development, performance appraisal, and rewarding (e.g., managing pay and benefit systems)." [Human resource management. Wikipedia]
The human resources dashboard example "HR Dashboard" was designed using ConceptDraw PRO software extended with HR Dashboard solution from Management area of ConceptDraw Solution Park.
Human resources dashboard
 Comparison Dashboard
Comparison dashboard solution extends ConceptDraw DIAGRAM software with samples, templates and vector stencils library with charts and indicators for drawing the visual dashboard comparing data.
This HR dashboard sample shows two thematic maps with KPIs by European countries: training time per employee, and productivity rate growth after training.
"Human resource management regards training and development as a function concerned with organizational activity aimed at bettering the job performance of individuals and groups in organizational settings. ... The field has gone by several names, including "Human Resource Development", "Human Capital Development" and "Learning and Development"." [Training and development. Wikipedia]
The human resources dashboard example "Training and Development Dashboard" was designed using ConceptDraw PRO software extended with HR Dashboard solution from Management area of ConceptDraw Solution Park.
Training time per employee, hours/year
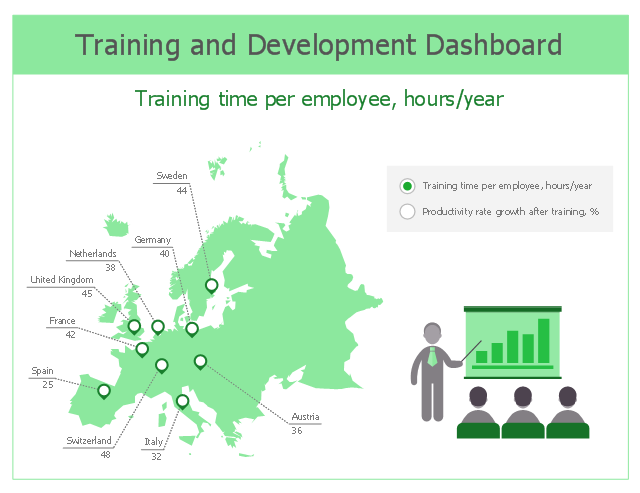
Productivity rate growth after training, %

"As a discipline, task management embraces several key activities. Various conceptual breakdowns exist, and these, at a high-level, always include creative, functional, project, performance and service activities.
Creative activities pertain to task creation. In context, these should allow for task planning, brainstorming, creation, elaboration, clarification, organization, reduction, targeting and preliminary prioritization.
Functional activities pertain to personnel, sales, quality or other management areas, for the ultimate purpose of ensuring production of final goods and services for delivery to customers. In context these should allow for planning, reporting, tracking, prioritizing, configuring, delegating, and managing of tasks.
Project activities pertain to planning and time and costs reporting. These can encompass multiple functional activities but are always greater and more purposeful than the sum of its parts. In context project activities should allow for project task breakdown, task allocation, inventory across projects, and concurrent access to task databases.
Service activities pertain to client and internal company services provision, including customer relationship management and knowledge management. In context these should allow for file attachment and links to tasks, document management, access rights management, inventory of client & employee records, orders & calls management, and annotating tasks.
Performance activities pertain to tracking performance and fulfillment of assigned tasks. In context these should allow for tracking by time, cost control, stakeholders and priority; charts, exportable reports, status updates, deadline adjustments, and activity logging.
Report activities pertain to the presentation of information regarding the other five activities listed, including graphical display." [Task management. Wikipedia]
The example "Project tasks dashboard" was created using the ConceptDraw PRO diagramming and vector drawing software extended with the Status Dashboard solution from the area "What is a Dashboard" of ConceptDraw Solution Park.
Project tasks dashboard

Data Visualization Solutions

 ConceptDraw Dashboard for Facebook
ConceptDraw Dashboard for Facebook solution extends ConceptDraw DIAGRAM software with a dynamically updated visual dashboard, which shows lifetime total likes, daily friends of fans, and daily page views, information you can receive from Facebook Insights.
 HR Flowcharts
Human resource management diagrams show recruitment models, the hiring process and human resource development of human resources.
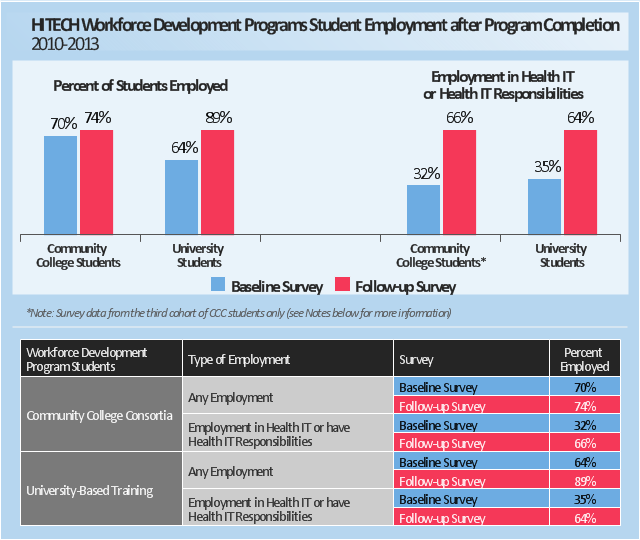
This example was drawn on the base of the dashboard "HITECH Workforce Development Programs Student Employment after Program Completion
2010-2013" from the Health IT Dashboard website of the Office of the National Coordinator for Health IT (ONC) of the U.S. Department of Health and Human Services (HHS).
[dashboard.healthit.gov/ quickstats/ pages/ FIG-Students-Employed-after-Program-Completion.html]
"In February, 2009 Congress passed the Health Information Technology for Economic and Clinical Health (HITECH) Act - a part of the American Recovery and Reinvestment Act - to spur the growth of secure electronic health records that put the right information at the fingertips of doctors and patients. To make this change possible, health care providers will need an increased workforce of skilled health IT specialists as they transition to electronic health records (EHRs). To address this need, the Office of the National Coordinator for Health Information Technology (ONC) created the Health IT Workforce Development Program, which includes the Community College Consortia Program, University-Based Training Program, Curriculum Development Centers Program, and the Competency Examination Program." [dashboard.healthit.gov/ college/ ]
The example "Health IT dashboard" was created using the ConceptDraw PRO diagramming and vector drawing software extended with the Comparison Dashboard solution from the area "What is a Dashboard" of ConceptDraw Solution Park.
Visual dashboard
 Meter Dashboard
Meter dashboard solution extends ConceptDraw DIAGRAM software with templates, samples and vector stencils library with meter indicators for drawing visual dashboards showing quantitative data.
Ways You Can Visualize Sales Data

- Projects HR dashboard | Employee distribution - HR dashboard ...
- Employee distribution - HR dashboard | Frequency Distribution ...
- Employee distribution - HR dashboard | Projects HR dashboard | HR ...
- Sample Hr Dashboard
- HR Dashboard | HR Performance Dashboard | Visualize Sales Data ...
- Employee distribution - HR dashboard | HR dashboard | Frequency ...
- Enterprise dashboard | KPI Dashboard | HR Flowcharts | Human ...
- Employee distribution - HR dashboard | HR Flowcharts | School and ...
- Sales revenue - Dashboard | Sales Dashboard | HR Dashboard ...
- HR Dashboard | KPI Dashboard | HR Performance Dashboard ...
- Human Capital Dashboard Examples
- HR dashboard | Projects HR dashboard | Frequency Distribution ...
- Projects HR dashboard | Revenue and Employment Cost ...
- UK labour market categories | Employee distribution - HR ...
- Projects HR dashboard | Human Resource Development | Selecting ...
- Sales Growth. Bar Graphs Example | Revenue and Employment ...
- Interior Design. Storage and Distribution — Design Elements ...
- Project Dashboard Example
- Georgia DOT performance management - Meter dashboard ...