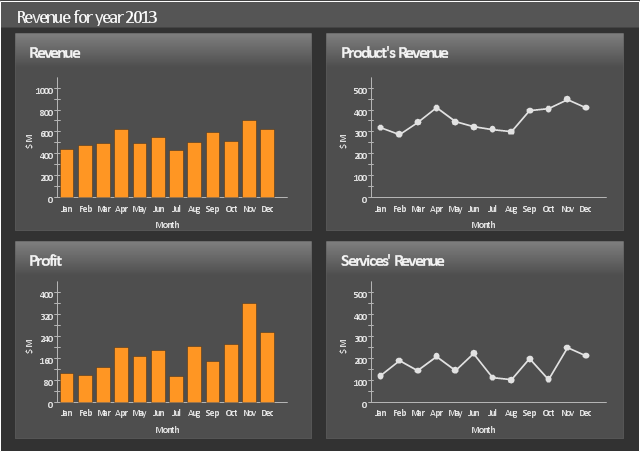
This sales dashboard sample shows how key performance parameters such as revenue, profit, product's revenue and product's profit change in time using bar charts and line graphs.
The dashboard example "Sales revenue" was created using the ConceptDraw PRO diagramming and vector drawing software extended with the Sales Dashboard solution from the Marketing area of ConceptDraw Solution Park.
The dashboard example "Sales revenue" was created using the ConceptDraw PRO diagramming and vector drawing software extended with the Sales Dashboard solution from the Marketing area of ConceptDraw Solution Park.
Sales dashboard
 Sales Dashboard
Sales Dashboard solution extends ConceptDraw DIAGRAM software with templates, samples and library of vector stencils for drawing the visual dashboards of sale metrics and key performance indicators (KPI).
 HR Dashboard
The HR Dashboard solution extends ConceptDraw DIAGRAM functionality with powerful drawing tools and great collection of comprehensive vector design elements, icons, pictograms and objects, navigation elements, live objects of HR charts, HR indicators, and thematic maps. The range of HR Dashboards applications is extensive, among them the human resource management, recruitment, hiring process, human resource development. ConceptDraw DIAGRAM software is perfect for creation HR Dashboard with any goal you need. It gives you all opportunities for designing not only informative, but also professional looking and attractive HR Dashboards of any style and degree of detalization, that are perfect for using in presentations, reports and other thematic documents.
Sales Dashboard
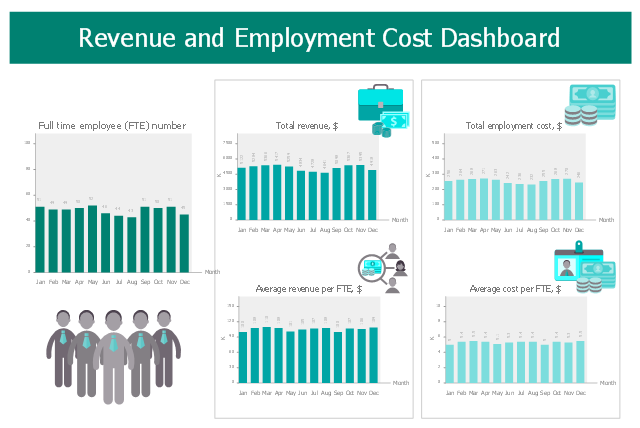
This HR dashboard sample visualizes KPIs: full time employee (FTE) number, total revenue, average revenue per FTE, total employment cost, average cost per FTE.
"Employment is a relationship between two parties, usually based on a contract where work is paid for, where one party, which may be a corporation, for profit, not-for-profit organization, co-operative or other entity is the employer and the other is the employee. Employees work in return for payment, which may be in the form of an hourly wage, by piecework or an annual salary, depending on the type of work an employee does or which sector she or he is working in. Employees in some fields or sectors may receive gratuities, bonus payment or stock options. In some types of employment, employees may receive benefits in addition to payment. Benefits can include health insurance, housing, disability insurance or use of a gym." [Employment. Wikipedia]
The human resources dashboard example "Revenue and Employment Cost Dashboard" was designed using ConceptDraw PRO software extended with HR Dashboard solution from Management area of ConceptDraw Solution Park.
HR dashboard
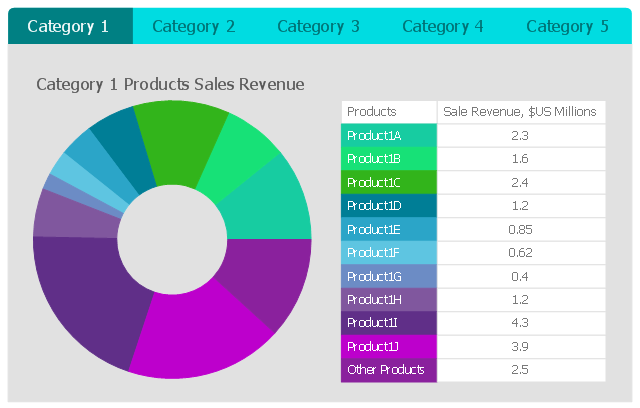
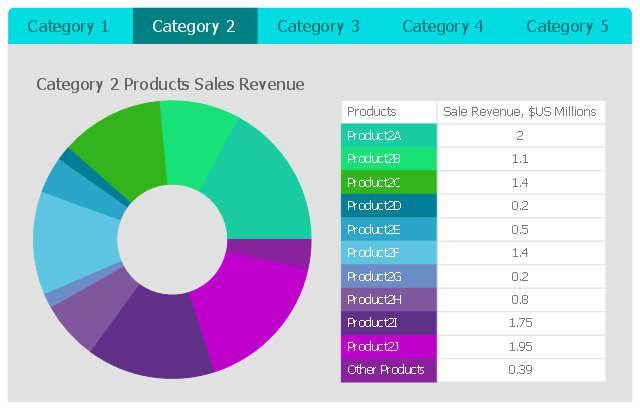
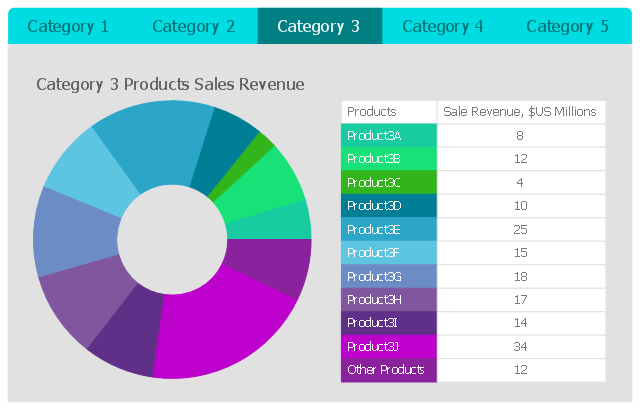
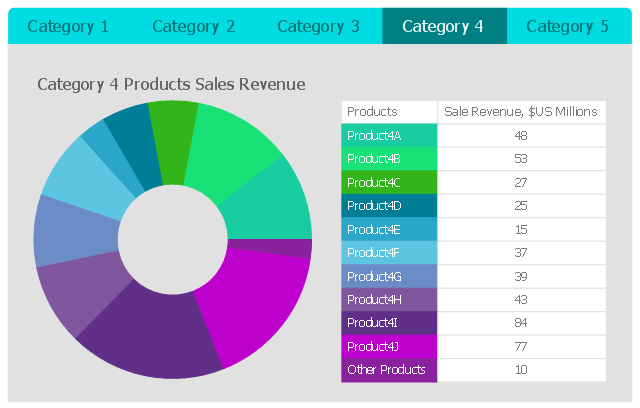
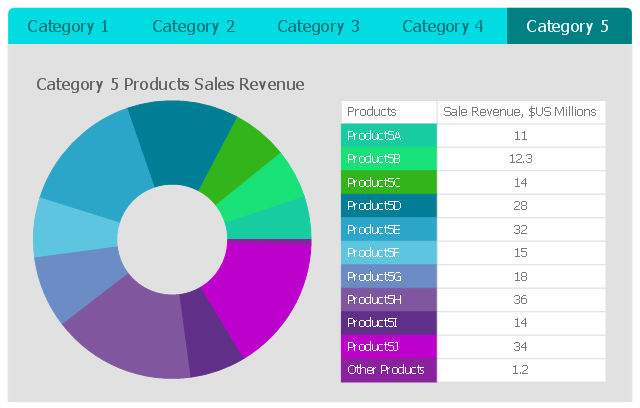
This business intelligence dashboard sample shows the quarter sales revenue for top 10 products by categories using donut charts.
"A doughnut chart (also spelled donut) is a variant of the pie chart, with a blank center allowing for additional information about the data as a whole to be included." [Pie chart. Wikipedia]
The BI dashboard example "Quarter Sales Revenue for Top 10 Products by Categories" was created using ConceptDraw PRO software extended with the Business Intelligence Dashboards solution from the Business Processes area of ConceptDraw Solution Park.
Category 1
Category 2
Category 3
Category 4
Category 5
 Business Intelligence Dashboard
Business Intelligence Dashboard solution extends the ConceptDraw DIAGRAM functionality with exclusive tools, numerous ready-to-use vector objects, samples and quick-start templates for creation professional Business Intelligence Dashboards, Business Intelligence Graphics, Business Intelligence Charts and Maps of different kinds. Design easy the BI dashboard, BI model or Dynamic chart in ConceptDraw DIAGRAM to monitor the company's work, to track the indicators corresponding your company's data, to display and analyze key performance indicators, to evaluate the trends and regularities of the processes occurring at the company.
Dashboard

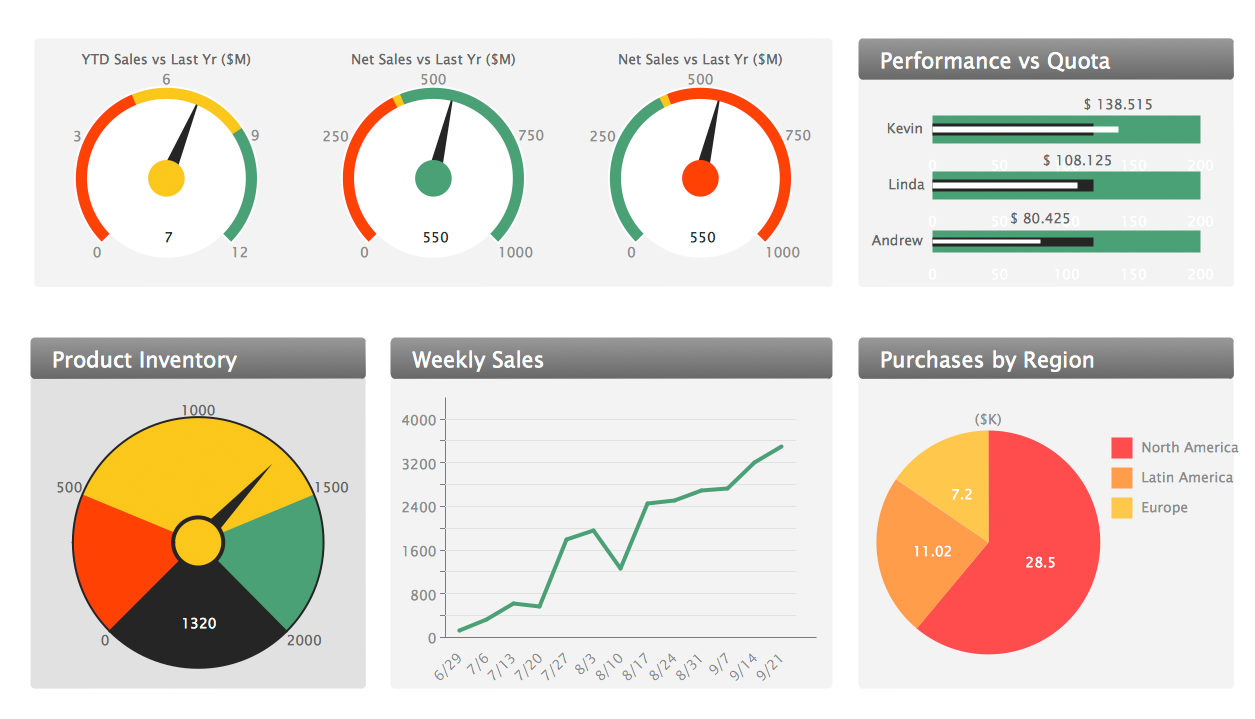
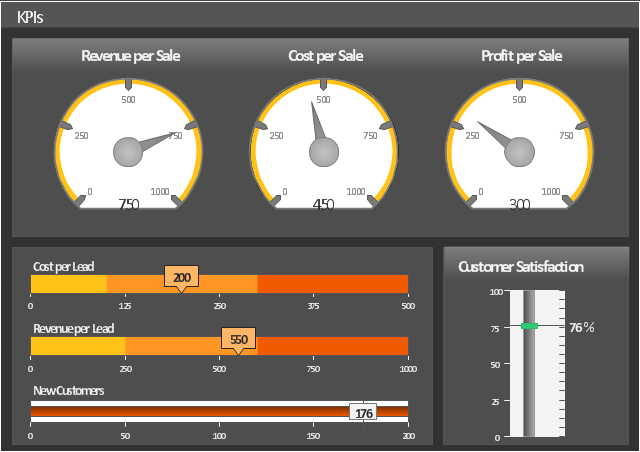
This sales KPIs dashboard sample indicates sale group effectiveness by different parameters, such as Revenue per Sale, Cost per Sale, Profit per Sale, Customer Satisfaction, Cost per Lead and Revenue per Lead using gauge and slider indicators.
The performance dashboard example "Sales KPIs" was created using the ConceptDraw PRO diagramming and vector drawing software extended with the Sales Dashboard solution from the Marketing area of ConceptDraw Solution Park.
The performance dashboard example "Sales KPIs" was created using the ConceptDraw PRO diagramming and vector drawing software extended with the Sales Dashboard solution from the Marketing area of ConceptDraw Solution Park.
Sales dashboard
 Meter Dashboard
Meter dashboard solution extends ConceptDraw DIAGRAM software with templates, samples and vector stencils library with meter indicators for drawing visual dashboards showing quantitative data.
- Sales Growth. Bar Graphs Example | Strategy Map | Sales ...
- Revenue Cost Dashboard
- Sales Dashboard | Sales Dashboard | Business Intelligence ...
- Revenue Process Flowchart
- Logistics Performance Dashboard - Template | Sales KPIs ...
- Sales Dashboard | Sales revenue - Dashboard | Sales Dashboard ...
- Revenue Cycle Flowchart Examples
- Business Intelligence Dashboard | Area Charts | Pie Charts ...
- Block Diagrams | Sales Dashboard | System Flowchart Diagram ...