This projects HR dashboard example includes the histogram of employees distribution by salary, the area chart of salari distribution, and two horizontal bar charts: "Employees by Project Teams" and "Payroll Breakdown".
"Project Portfolio Management (PPM) is the centralized management of processes, methods, and technologies used by project managers and project management offices (PMOs) to analyze and collectively manage a group of current or proposed projects based on numerous key characteristics. The objectives of PPM are to determine the optimal resource mix for delivery and to schedule activities to best achieve an organization’s operational and financial goals ― while honouring constraints imposed by customers, strategic objectives, or external real-world factors. ... With PPM, the Office of Finance can improve their accuracy for estimating and managing the financial resources of a project or group of projects. In addition, the value of projects can be demonstrated in relation to the strategic objectives and priorities of the organization through financial controls and to assess progress through earned value and other project financial techniques." [Project portfolio management. Wikipedia]
The example "Projects HR dashboard" was created using the ConceptDraw PRO diagramming and vector drawing software extended with the Frequency Distribution Dashboard solution from the area "What is a Dashboard" of ConceptDraw Solution Park.
Visual dashboard

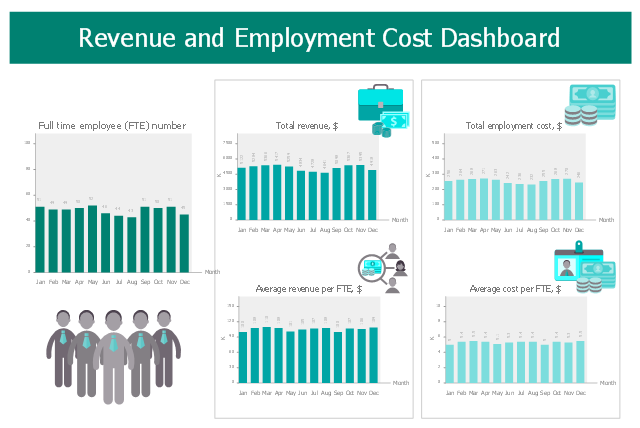
This HR dashboard sample visualizes KPIs: full time employee (FTE) number, total revenue, average revenue per FTE, total employment cost, average cost per FTE.
"Employment is a relationship between two parties, usually based on a contract where work is paid for, where one party, which may be a corporation, for profit, not-for-profit organization, co-operative or other entity is the employer and the other is the employee. Employees work in return for payment, which may be in the form of an hourly wage, by piecework or an annual salary, depending on the type of work an employee does or which sector she or he is working in. Employees in some fields or sectors may receive gratuities, bonus payment or stock options. In some types of employment, employees may receive benefits in addition to payment. Benefits can include health insurance, housing, disability insurance or use of a gym." [Employment. Wikipedia]
The human resources dashboard example "Revenue and Employment Cost Dashboard" was designed using ConceptDraw PRO software extended with HR Dashboard solution from Management area of ConceptDraw Solution Park.
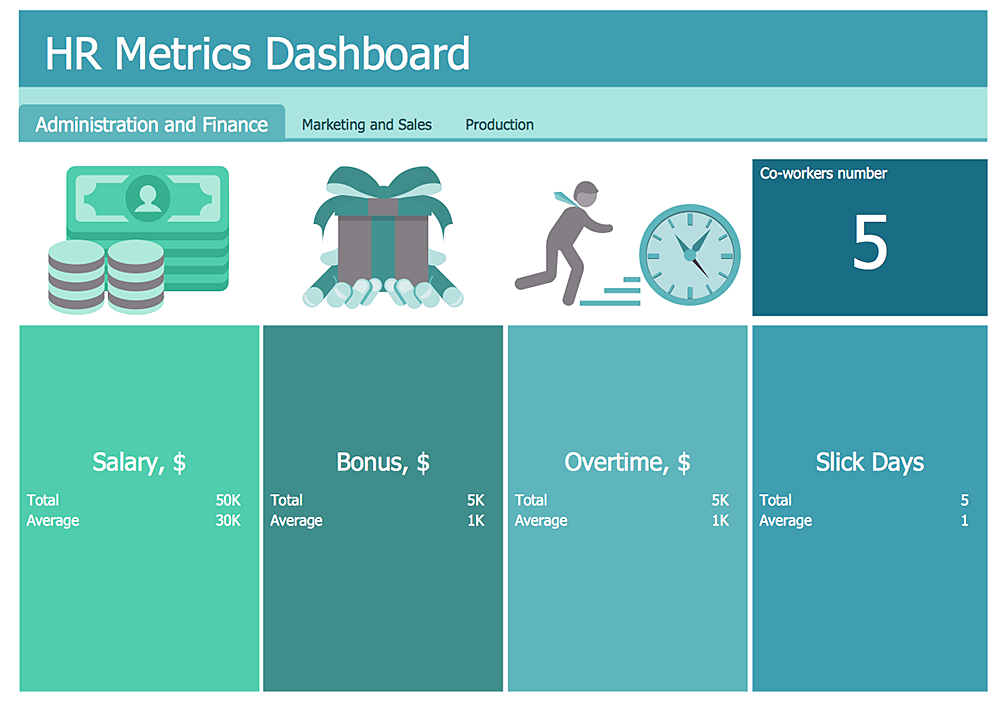
HR dashboard
 HR Dashboard
The HR Dashboard solution extends ConceptDraw DIAGRAM functionality with powerful drawing tools and great collection of comprehensive vector design elements, icons, pictograms and objects, navigation elements, live objects of HR charts, HR indicators, and thematic maps. The range of HR Dashboards applications is extensive, among them the human resource management, recruitment, hiring process, human resource development. ConceptDraw DIAGRAM software is perfect for creation HR Dashboard with any goal you need. It gives you all opportunities for designing not only informative, but also professional looking and attractive HR Dashboards of any style and degree of detalization, that are perfect for using in presentations, reports and other thematic documents.
Swim Lane Diagrams

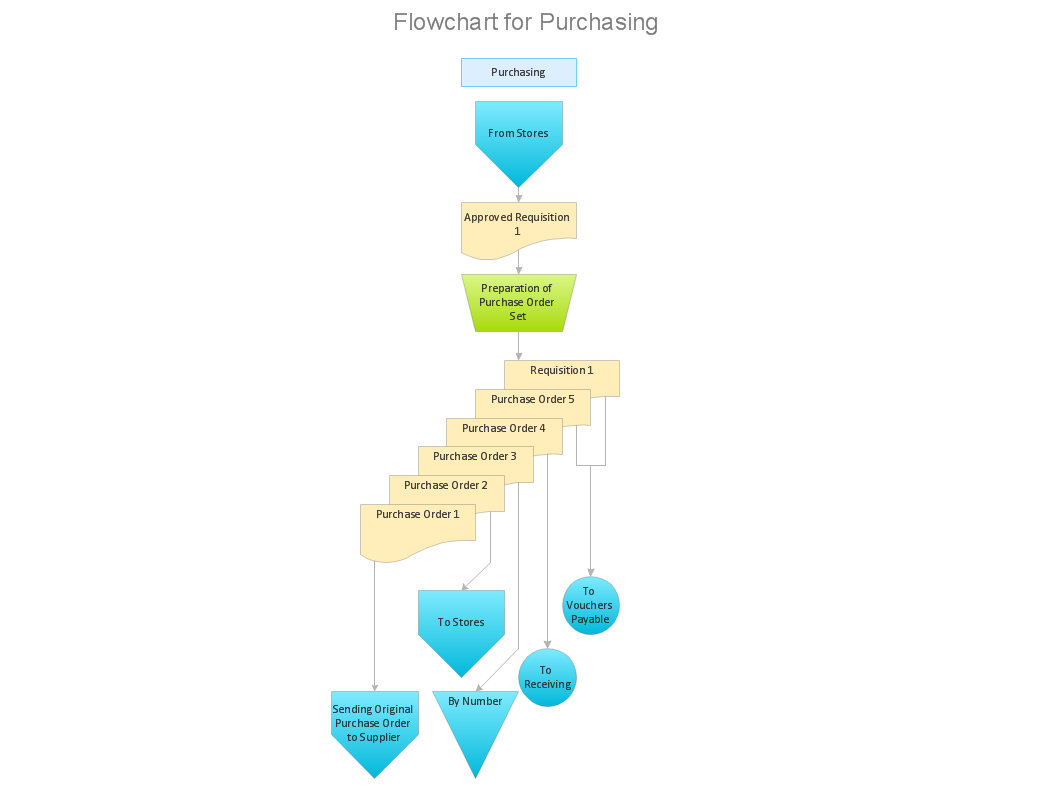
 HR Flowcharts
Human resource management diagrams show recruitment models, the hiring process and human resource development of human resources.


HelpDesk
How To Create an HR Metric Dashboard
Best Program to Make Flow Chart Diagrams

How Do You Make An Accounting Process Flowchart?
 Jackson Structured Programming (JSP) Diagrams
The Jackson Structured Programming (JSP) Diagram solution extends the functionality and drawing abilities of the ConceptDraw DIAGRAM software with set of illustrative JSP diagrams samples and large variety of predesigned vector objects of actions, processes, procedures, selection, iteration, as well as arrows and connectors to join the objects during Jackson structured development and designing Jackson structured programming diagrams, JSP diagram, Jackson structure diagram (JSD), Program structure diagram. The powerful abilities of this solution make the ConceptDraw DIAGRAM ideal assistant for programmers, software developers, structural programmers, computer engineers, applications constructors, designers, specialists in structured programming and Jackson systems design, and other technical, computer and software specialists.
- Draw A Flow Chart To Find The Salary Of A Highly Paid Employee In
- Projects HR dashboard | Employee distribution - HR dashboard ...
- Employee distribution - HR dashboard | HR Dashboard | Frequency ...
- ConceptDraw Solution Park | HR Flowcharts | Bar Graphs | Hr ...
- Employee distribution - HR dashboard | Projects HR dashboard | HR ...
- Employee distribution - HR dashboard | HR dashboard | Projects HR ...
- HR dashboard | Projects HR dashboard | Frequency Distribution ...
- Projects HR dashboard | Competitor Analysis | Six Markets Model ...
- How Do You Make a Histogram? | Projects HR dashboard | Seven ...
- Salary System Flow Chart Sample