 ConceptDraw Solution Park
ConceptDraw Solution Park collects graphic extensions, examples and learning materials
 HR Flowcharts
Human resource management diagrams show recruitment models, the hiring process and human resource development of human resources.
 Bar Graphs
Bar graphs solution extends ConceptDraw PRO software with templates, samples and library of vector stencils for drawing the bar charts.
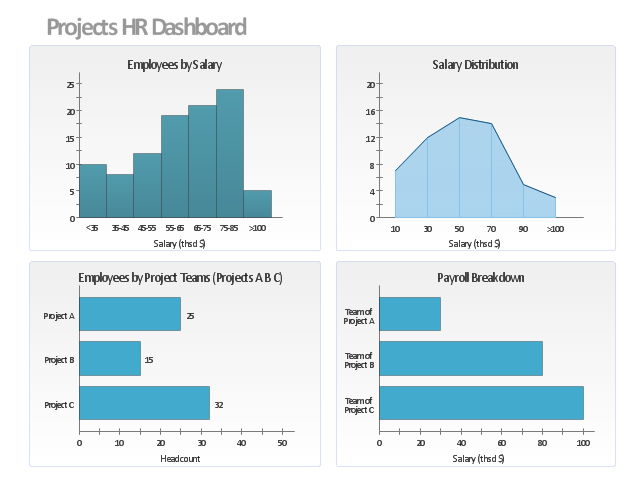
This projects HR dashboard example includes the histogram of employees distribution by salary, the area chart of salari distribution, and two horizontal bar charts: "Employees by Project Teams" and "Payroll Breakdown".
"Project Portfolio Management (PPM) is the centralized management of processes, methods, and technologies used by project managers and project management offices (PMOs) to analyze and collectively manage a group of current or proposed projects based on numerous key characteristics. The objectives of PPM are to determine the optimal resource mix for delivery and to schedule activities to best achieve an organization’s operational and financial goals ― while honouring constraints imposed by customers, strategic objectives, or external real-world factors. ... With PPM, the Office of Finance can improve their accuracy for estimating and managing the financial resources of a project or group of projects. In addition, the value of projects can be demonstrated in relation to the strategic objectives and priorities of the organization through financial controls and to assess progress through earned value and other project financial techniques." [Project portfolio management. Wikipedia]
The example "Projects HR dashboard" was created using the ConceptDraw PRO diagramming and vector drawing software extended with the Frequency Distribution Dashboard solution from the area "What is a Dashboard" of ConceptDraw Solution Park.
 Picture Graphs
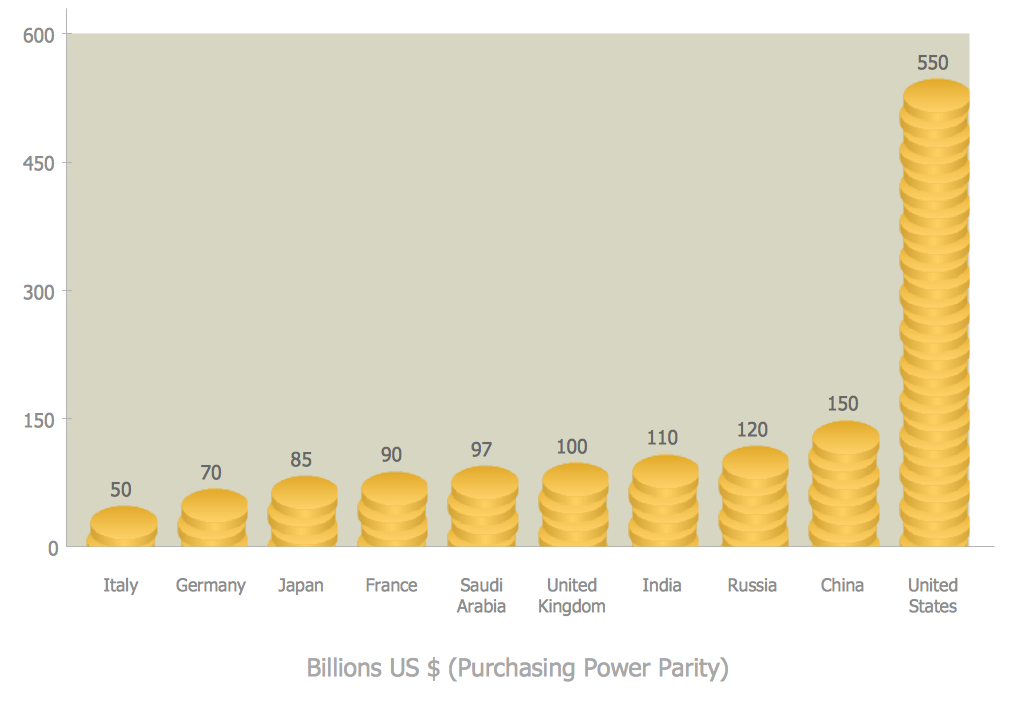
Picture Graphs solution extends ConceptDraw PRO software with templates, samples and library of vector stencils for drawing the picture charts.
 Line Graphs
Line Graphs solution extends ConceptDraw PRO software with templates, samples and library of vector stencils for drawing the line charts.
Visual Presentations Made Easy with Diagramming Software
Automatically create a presentation-quality diagram in one click with ConceptDraw PRO.
 Area Charts
Area charts solution extends ConceptDraw PRO with templates, samples and library of vector stencils for drawing the area graphs.
 Pie Charts
Pie Charts solution extends ConceptDraw PRO software with templates, samples and library of vector stencils for drawing the pie and donut charts.
 Management Area
The solutions from Management area of ConceptDraw Solution Park collect templates, samples and libraries of vector stencils for drawing the management diagrams and mind maps.
 Organizational Charts
Organizational Charts solution extends ConceptDraw PRO software with samples, templates and library of vector stencils for drawing the org charts.
 Audit Flowcharts
Audit flowcharts solution extends ConceptDraw PRO software with templates, samples and library of vector stencils for drawing the audit and fiscal flow charts.
 Food Court
Use the Food Court solution to create food art. Pictures of food can be designed using libraries of food images, fruit art and pictures of vegetables.
 Frequency Distribution Dashboard
Frequency distribution dashboard solution extends ConceptDraw PRO software with samples, templates and vector stencils libraries with histograms and area charts for drawing the visual dashboards showing frequency distribution of data.
HelpDesk
How to Create a Picture Graph in ConceptDraw PRO
Picture Graphs are used commonly to represent non-complex data to a large audience. A Picture Graph is simple kind of marketing diagram used to show the relationship among various quantities. It include pictures or symbols to represent information visually. There are many cases when you have just some numbers to show and compare. This is not a reason to not use visual tools. You can produce a simple picture graph using memorable symbols to get the best visual presentation. Using specific symbols instead of regular colored bars makes picture graphs a much more descriptive tool. You can use tools from an existing library or find appropriate clipart in ConceptDraw’s collection. ConceptDraw PRO allows you to draw a simple and easy to understand Graph Charts using the special library.
 What is a Dashboard Area
Solutions from the area What is a Dashboard of ConceptDraw Solution Park collects templates, samples and vector stencils libraries with of data driven charts and indicators for drawing the basic types of Visual Dashboards.
- Chart Examples | Projects HR dashboard | Column Chart Examples ...
- Projects HR dashboard | Simple Drawing Applications for Mac ...
- How to Draw a Histogram in ConceptDraw PRO | Chart Examples ...
- Financial Comparison Chart | Bar Diagrams for Problem Solving ...
- Flowchart - HR management process | HR dashboard | Projects HR ...
- Selecting & Creating Flowcharts | Visual Presentations Made Easy ...
- Hr Chart
- Design elements - Meter indicators | Hr Metrics Dashboard Example
- Types of Flowchart - Overview | Process Flowchart | How to Draw a ...
- HR dashboard | Projects HR dashboard | Employee dashboard | Hr ...
- HR Flowcharts | HR Management Software | Recruitment | Flowchart ...
- Types of Flowchart - Overview | Flowchart - HR management ...
- How to Draw an Area Chart in ConceptDraw PRO | Area Charts ...
- Projects HR dashboard | Frequency Distribution Dashboard | Hr ...
- Normal (Gaussian) distribution graph | Design elements - Frequency ...
- Process Flowchart | Flowchart | Process Flow Chart | Flowchart ...
- Selecting & Creating Flowcharts | Flowchart Process Example | Flow ...
- HR management process - Flowchart | Human Resource ...
- Human Resource Development | Process Flowchart | Basic ...
- Sales Growth. Bar Graphs Example | Sales department - Vector ...


