Basic Flowchart Images. Flowchart Examples

The vector stencils library "Picture Graphs" contains 4 image chart templates. Use it to design your pictorial bar charts in ConceptDraw PRO diagramming and vector drawing software.
"Pictorial bar graph.
Sometimes reffered to as a pictographs. A pictorial bar graph is a graph in which the rectangular bars have been filled with pictures, sketches, icons, etc. or where pictures, sketches, icons, etc. have been substituted for the rectangular bars. In both variations, one or more symbols might be used in each bar. The two major reasons for using pictorial graphs are to make the graph more appealing visually and to facilitate better communications." [Information Graphics: A Comprehensive Illustrated Reference. R. L. Harris. 1999. p.41]
The chart templates example "Design elements - Picture graphs" is included in the Basic Picture Graphs solution from the Graphs and Charts area of ConceptDraw Solution Park.
Pictorial chart templates

This pictorial chart sample shows the population growth by continent in 2010-2013.
"Population growth' refers to the growth in human populations. Global population growth is around 80 million annually, or 1.2% p.a. The global population has grown from 1 billion in 1800 to 7 billion in 2012. It is expected to keep growing to reach 11 billion by the end of the century. Most of the growth occurs in the nations with the most poverty, showing the direct link between high population growth and low standards of living. The nations with high standards of living generally have low or zero rates of population growth. Australia's population growth is around 400,000 annually, or 1.8% p.a., which is nearly double the global average. It is caused mainly by very high immigration of around 200,000 p.a., the highest immigration rate in the world. Australia remains the only nation in the world with both high population growth and high standards of living." [Population growth. Wikipedia]
The image chart example "Population growth by continent, 2010 - 2013" was created using the ConceptDraw PRO diagramming and vector drawing software extended with the Basic Picture Graphs solution from the Graphs and Charts area of ConceptDraw Solution Park.
Image chart

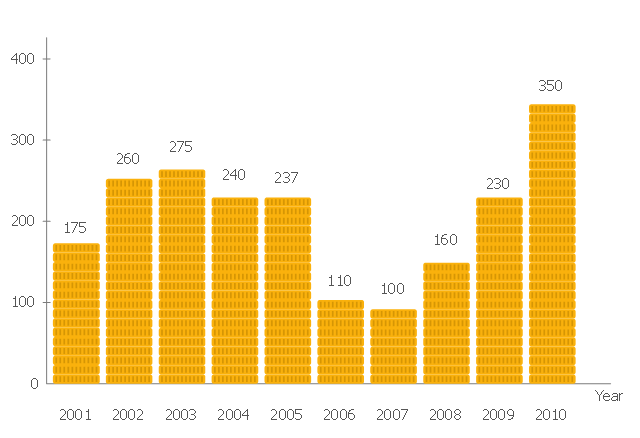
This image graph sample shows the total financing of the Philippines from 2001-2010. This pictorial bar chart was designed on the base of the Wikimedia Commons file: Financing-Total.png. [commons.wikimedia.org/ wiki/ File:Financing-Total.png]
This file is licensed under the Creative Commons Attribution-Share Alike 3.0 Unported license. [creativecommons.org/ licenses/ by-sa/ 3.0/ deed.en]
"The Economy of the Philippines is the 40th largest in the world, according to 2012 International Monetary Fund statistics, and is also one of the emerging markets in the world. The Philippines is considered as a newly industrialized country, which has been transitioning from being one based on agriculture to one based more on services and manufacturing. According to the World Bank ICP 2011, the estimated 2011 GDP (purchasing power parity) was $543.7 billion." [Economy of the Philippines. Wikipedia]
The image chart example "The total financing of the Philippines from 2001-2010" was created using the ConceptDraw PRO diagramming and vector drawing software extended with the Marketing Diagrams solution from the Marketing area of ConceptDraw Solution Park.
Marketing graph
This picture bar graph sample shows regional population growth from 2010 to 2016. It was designed using data from the Wikipedia article List of continents by population.
[en.wikipedia.org/ wiki/ List_ of_ continents_ by_ population]
"Population geography is a division of human geography. It is the study of the ways in which spatial variations in the distribution, composition, migration, and growth of populations are related to the nature of places. Population geography involves demography in a geographical perspective. It focuses on the characteristics of population distributions that change in a spatial context." [Population geography. Wikipedia]
The pictorial chart example "Regional population growth from 2010 to 2016" was created using the ConceptDraw PRO diagramming and vector drawing software extended with the Picture Graphs solution from the Graphs and Charts area of ConceptDraw Solution Park.
Image chart

Picture Graph

This picture bar graph sample shows the computer and Internet use at home from 1984 to 2014. It was designed using data from website of the United States Census Bureau (USCB).
[census.gov/ content/ dam/ Census/ library/ visualizations/ 2016/ comm/ digital_ nation.png]
"Home automation is the residential extension of building automation and involves the control and automation of lighting, heating, ventilation, air conditioning (HVAC), appliances, and security. Modern systems generally consist of switches and sensors connected to a central hub sometimes called a "gateway" from which the system is controlled with a user interface that is interacted either with a wall-mounted terminal, mobile phone software, tablet computer or a web interface." [Home automation. Wikipedia]
The pictorial chart example "Computer and Internet use at home over time" was created using the ConceptDraw PRO diagramming and vector drawing software extended with the Picture Graphs solution from the Graphs and Charts area of ConceptDraw Solution Park.
Image chart

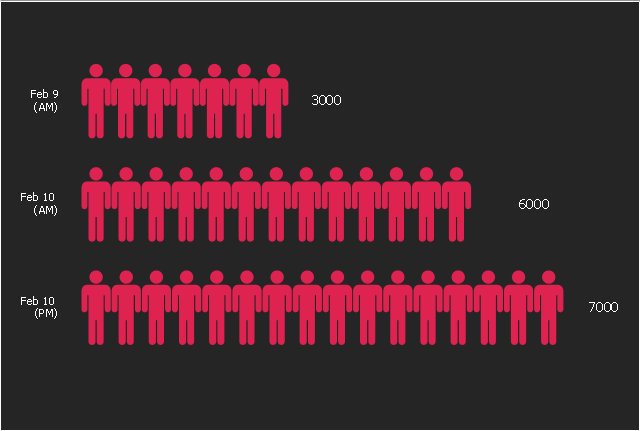
This picture bar graph sample shows increse in subscibers on YouTube to Anonymous' videos in 2008. It was designed on the base of the Wikimedia Commons file: A graph to show the increse in subscibers on YouTube to Anonymous' videos.jpg. [commons.wikimedia.org/ wiki/ File:A_ graph_ to_ show_ the_ increse_ in_ subscibers_ on_ YouTube_ to_ Anonymous%27_ videos.jpg]
This file is licensed under the Creative Commons Attribution 3.0 Unported license. [creativecommons.org/ licenses/ by/ 3.0/ deed.en]
"Anonymous (used as a mass noun) is a loosely associated international network of activist and hacktivist entities. A website nominally associated with the group describes it as "an internet gathering" with "a very loose and decentralized command structure that operates on ideas rather than directives". The group became known for a series of well-publicized publicity stunts and distributed denial-of-service (DDoS) attacks on government, religious, and corporate websites.
Anonymous originated in 2003 on the imageboard 4chan, representing the concept of many online and offline community users simultaneously existing as an anarchic, digitized global brain. Anonymous members (known as "Anons") can be distinguished in public by the wearing of stylised Guy Fawkes masks." [Anonymous (group). Wikipedia]
The pictorial chart example "The increse in subscibers on YouTube to Anonymous' videos" was created using the ConceptDraw PRO diagramming and vector drawing software extended with the Picture Graphs solution from the Graphs and Charts area of ConceptDraw Solution Park.
Image chart
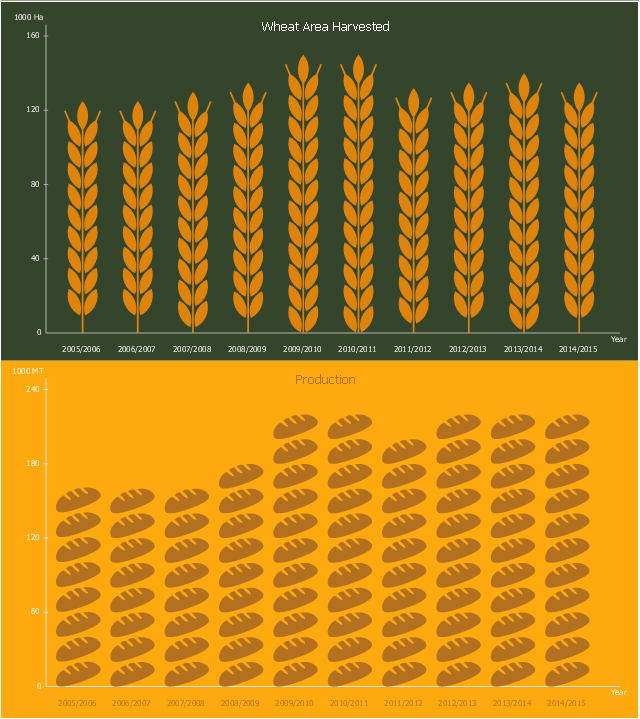
This picture bar graph sample shows wheat area harvested and production in Peru from 2006 to 2015. It was designed using data from website of the Foreign Agriculfural Service, the U.S. Department of Agriculture (USDA).
"Wheat remains a minor crop in Peru with most of the production concentrated in the temperate, southern highlands. Grown at 2,800 to 3,500 meters above sea level, production remains limited by geography as well as current economics. The Peruvian farmer cultivates only about two hectares of wheat, on average. While wheat production has increased slightly since 1994, it has remained relatively stable for the last six years at around 225,000 MT."
[fas.usda.gov/ data/ peru-wheat-production-limited-competition-corn-and-quinoa]
The pictorial chart example "Peru wheat area and production" was created using the ConceptDraw PRO diagramming and vector drawing software extended with the Picture Graphs solution from the Graphs and Charts area of ConceptDraw Solution Park.
Image chart
This picture bar graph sample shows the computer and Internet use at home from 1984 to 2014. It was designed using data from website of the United States Census Bureau (USCB).
[census.gov/ content/ dam/ Census/ library/ visualizations/ 2016/ comm/ digital_ nation.png]
"Home automation is the residential extension of building automation and involves the control and automation of lighting, heating, ventilation, air conditioning (HVAC), appliances, and security. Modern systems generally consist of switches and sensors connected to a central hub sometimes called a "gateway" from which the system is controlled with a user interface that is interacted either with a wall-mounted terminal, mobile phone software, tablet computer or a web interface." [Home automation. Wikipedia]
The pictorial chart example "Computer and Internet use at home over time" was created using the ConceptDraw PRO diagramming and vector drawing software extended with the Picture Graphs solution from the Graphs and Charts area of ConceptDraw Solution Park.
[census.gov/ content/ dam/ Census/ library/ visualizations/ 2016/ comm/ digital_ nation.png]
"Home automation is the residential extension of building automation and involves the control and automation of lighting, heating, ventilation, air conditioning (HVAC), appliances, and security. Modern systems generally consist of switches and sensors connected to a central hub sometimes called a "gateway" from which the system is controlled with a user interface that is interacted either with a wall-mounted terminal, mobile phone software, tablet computer or a web interface." [Home automation. Wikipedia]
The pictorial chart example "Computer and Internet use at home over time" was created using the ConceptDraw PRO diagramming and vector drawing software extended with the Picture Graphs solution from the Graphs and Charts area of ConceptDraw Solution Park.
Image chart
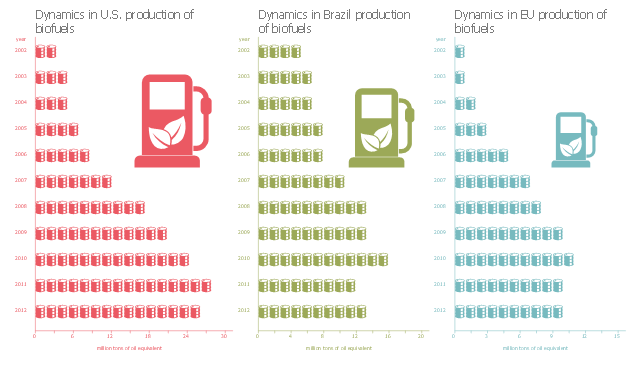
This picture bar graph sample shows biofuels production dynamics in U.S., Brazil and EU from 2002 to 2012. It was designed on the base of the Wikimedia Commons file: Production of biofuels.jpg.
[commons.wikimedia.org/ wiki/ File:Production_ of_ biofuels.jpg]
This file is made available under the Creative Commons CC0 1.0 Universal Public Domain Dedication. [creativecommons.org/ publicdomain/ zero/ 1.0/ deed.en]
"A biofuel is a fuel that is produced through contemporary biological processes, such as agriculture and anaerobic digestion, rather than a fuel produced by geological processes such as those involved in the formation of fossil fuels, such as coal and petroleum, from prehistoric biological matter. Biofuels can be derived directly from plants, or indirectly from agricultural, commercial, domestic, and/ or industrial wastes. Renewable biofuels generally involve contemporary carbon fixation, such as those that occur in plants or microalgae through the process of photosynthesis. Other renewable biofuels are made through the use or conversion of biomass (referring to recently living organisms, most often referring to plants or plant-derived materials). This biomass can be converted to convenient energy-containing substances in three different ways: thermal conversion, chemical conversion, and biochemical conversion. This biomass conversion can result in fuel in solid, liquid, or gas form. This new biomass can also be used directly for biofuels." [Biofuel. Wikipedia]
The pictorial chart example "Production of biofuels" was created using the ConceptDraw PRO diagramming and vector drawing software extended with the Picture Graphs solution from the Graphs and Charts area of ConceptDraw Solution Park.
Image chart
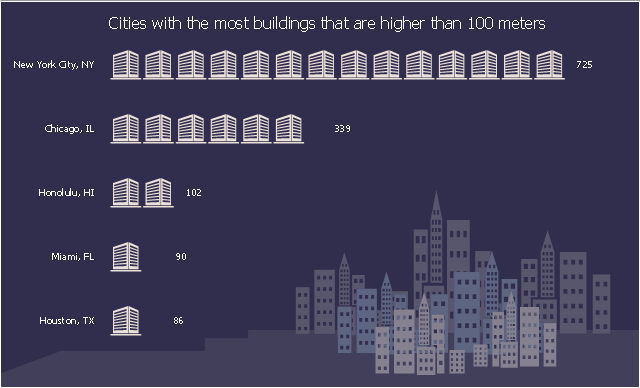
What Is a Picture Graph?

This picture bar graph sample shows the cities with the most skyscrapers. It was designed using data from the Cities infographic on the npr.org website. [npr.org/ news/ graphics/ 2012/ 07/ gr-Cities_ infographic-948.gif]
"A skyscraper is a tall, continuously habitable building of over 10 floors, mostly designed for office, commercial and residential uses. A skyscraper can also be called a high-rise, but the term skyscraper is often used for buildings higher than 50 m (164 ft). For buildings above a height of 300 m (984 ft), the term Supertall can be used, while skyscrapers reaching beyond 600 m (1,969 ft) are classified as Megatall." [Skyscraper. Wikipedia]
The pictorial chart example "Cities with the most skyscrapers" was created using the ConceptDraw PRO diagramming and vector drawing software extended with the Picture Graphs solution from the Graphs and Charts area of ConceptDraw Solution Park.
Image chart
Rainfall Bar Chart

 Basic Picture Graphs
This solution extends the capabilities of ConceptDraw DIAGRAM (or later) with templates, samples and a library of vector stencils for drawing Picture Graphs.
 Picture Graphs
Typically, a Picture Graph has very broad usage. They many times used successfully in marketing, management, and manufacturing. The Picture Graphs Solution extends the capabilities of ConceptDraw DIAGRAM with templates, samples, and a library of professionally developed vector stencils for designing Picture Graphs.
Area Chart

This pictorial bar chart sample shows the increse in subscibers on YouTube to Anonymous' videos. It was redesigned from the Wikimedia Commons file: A graph to show the increse in subscibers on YouTube to Anonymous' videos.jpg. [commons.wikimedia.org/ wiki/ File:A_ graph_ to_ show_ the_ increse_ in_ subscibers_ on_ YouTube_ to_ Anonymous%27_ videos.jpg]
This file is licensed under the Creative Commons Attribution 3.0 Unported license. [creativecommons.org/ licenses/ by/ 3.0/ deed.en]
"Anonymous (used as a mass noun) is a loosely associated international network of activist and hacktivist entities. A website nominally associated with the group describes it as "an internet gathering" with "a very loose and decentralized command structure that operates on ideas rather than directives". The group became known for a series of well-publicized publicity stunts and distributed denial-of-service (DDoS) attacks on government, religious, and corporate websites.
Anonymous originated in 2003 on the imageboard 4chan, representing the concept of many online and offline community users simultaneously existing as an anarchic, digitized global brain. Anonymous members (known as "Anons") can be distinguished in public by the wearing of stylised Guy Fawkes masks." [Anonymous (group). Wikipedia]
The image chart example "The increse in subscibers on YouTube to Anonymous' videos" was created using the ConceptDraw PRO diagramming and vector drawing software extended with the Basic Picture Graphs solution from the Graphs and Charts area of ConceptDraw Solution Park.
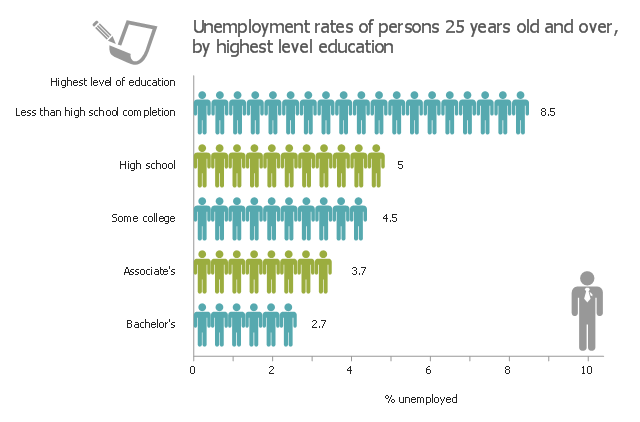
Picture bar graph
This picture bar graph sample shows unemployment rates of persons 25 years old and over in 2004. It was designed using data from the U.S. National Center for Education Statistics website. [nces.ed.gov/ nceskids/ help/ user_ guide/ graph/ bar.asp]
"Unemployment occurs when people who are without work are actively seeking paid work. The unemployment rate is a measure of the prevalence of unemployment and it is calculated as a percentage by dividing the number of unemployed individuals by all individuals currently in the labor force. During periods of recession, an economy usually experiences a relatively high unemployment rate." [Unemployment. Wikipedia]
The pictorial chart example "Unemployment rates of persons 25 years old and over" was created using the ConceptDraw PRO diagramming and vector drawing software extended with the Picture Graphs solution from the Graphs and Charts area of ConceptDraw Solution Park.
Image chart
- Drawing Images Of Chart Of Balanced Diet
- Picture Graph | Picture Graphs | Pictures of Graphs | Image Graphs
- A Picture Of A Block Graph
- Picture graph - Template
- Sample Pictorial Chart . Sample Infographics | Picture Graphs ...
- Design elements - Picture graphs | Picture graph - Template | Picture ...
- Population growth by continent | Infographic Maker | Sample ...
- Rainfall Bar Chart | Chart Maker for Presentations | Picture Graph ...
- Picture Graph | Picture Graphs | Picture graph - Template | Types Of ...
- Gantt chart examples | Chart Maker for Presentations | What Is a ...
- Design elements - Picture bar graphs | Picture Graph Or Pictograph
- Maths Pie Chart Design Image
- Basic Diagramming | Picture Graphs | How to Draw a Line Graph ...
- Pictures of Graphs | Picture Graph | Line Graph | Images Of Pie ...
- Picture Graphs | Competitor Analysis | What Is a Picture Graph ...
- Chart Examples | Bar Graph | Pie Graph Worksheets | Images Of Bar ...
- Image Of Balance Diet Chart For Drawing With Label
- Chart Templates | Pie Charts | Basic Line Graphs | Increase The ...
- Picture graph - Template | Manufacturing in America | Total value of ...